Bitcoin Analysis- Could Bitcoin Surpass $73,738? Insights on Upcoming Price Movements
Bitcoin Analysis– According to analyst Rekt Capital, Bitcoin and the broader crypto markets may be on the verge of a breakout if historical cycle patterns hold true. In a recent post on X, he analyzed previous market cycles and the implications for Bitcoin’s price trajectory.
Historical Breakout Patterns
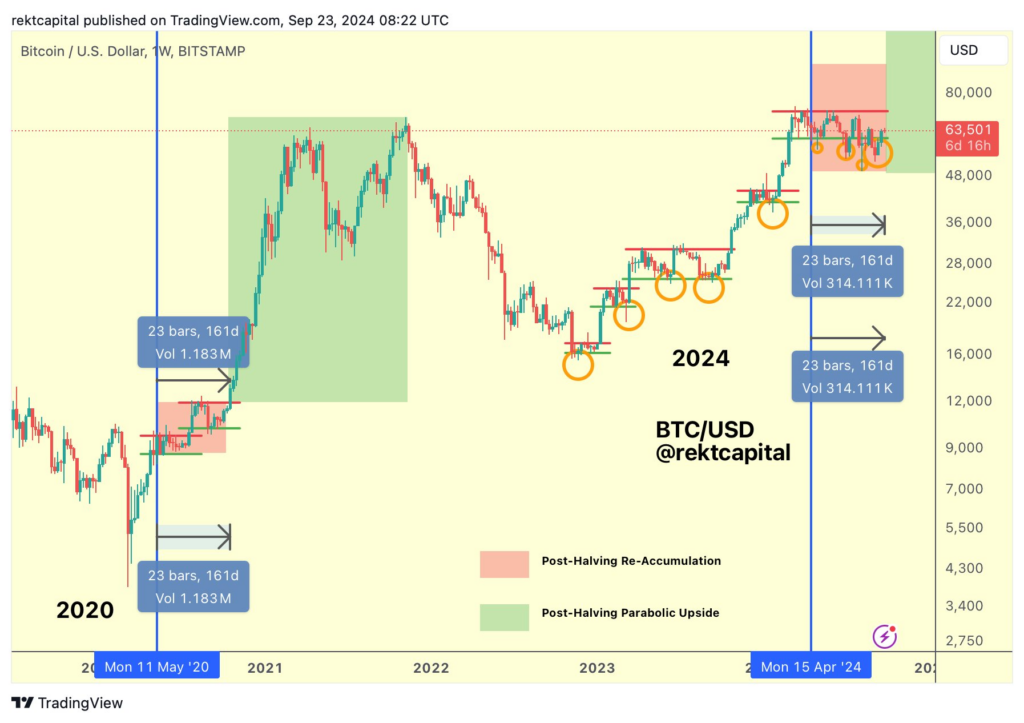
Rekt Capital pointed out that historically, Bitcoin has broken out from its reaccumulation range between 154 and 161 days after each halving event. The most recent Bitcoin halving occurred on April 20, which was 157 days ago. He stated,
History suggests it is ‘Breakout Time’ for Bitcoin.

In previous cycles, Bitcoin broke out 154 days after the 2016 halving and 161 days after the 2020 halving, indicating we are within the typical breakout timeframe.
September Performance and Future Outlook
While September has traditionally been a bearish month for Bitcoin, the analyst noted an interesting trend this year. On September 21, he remarked,
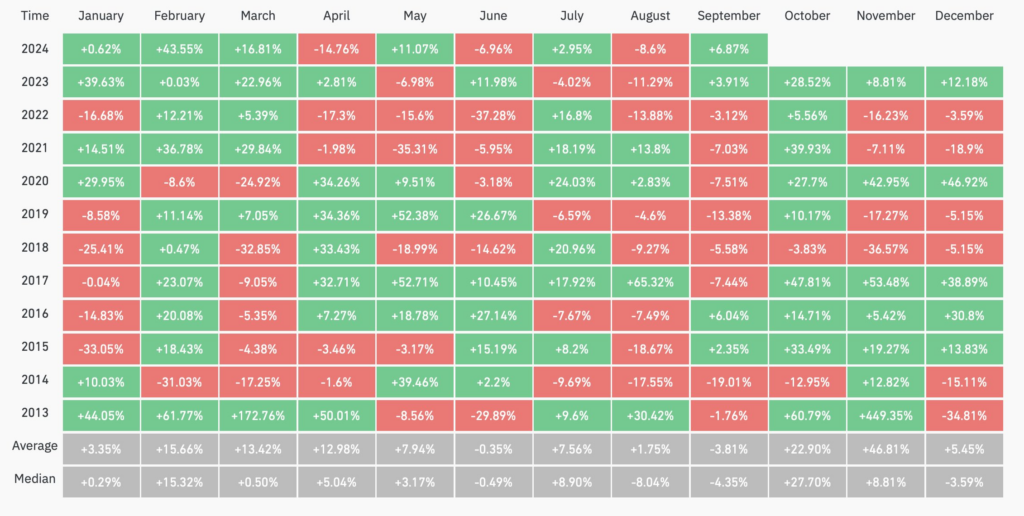
Who would’ve thought Bitcoin would print its highest-ever average return for the month of September in this cycle?
As of now, Bitcoin has risen approximately 9% this September, surpassing its second-best September in 2016, which saw a 6% gain.

October’s Positive Trends
Looking ahead, Rekt Capital highlighted that nine of the past eleven October months have yielded positive returns for Bitcoin. Notable bullish months like October 2017 and 2021 recorded gains of 48% and 40%, respectively. Currently, Bitcoin is trading sideways and must break its previous peak of $73,738 to enter a new price discovery range, sitting just 14.6% away from that level.
As of the latest data from CoinGecko, Bitcoin’s price is down 1.7% in the past 24 hours, trading at $62,863, after hitting a monthly peak of $65,600 on September 23.
FAQs
What is the historical pattern of Bitcoin breakouts after halving events?
Historically, Bitcoin has broken out from its reaccumulation range between 154 and 161 days after each halving event. The recent halving occurred on April 20, which puts us within this breakout timeframe.
How has Bitcoin performed in September this year?
In September 2023, Bitcoin has risen approximately 9%, marking its highest-ever average return for this month in the current cycle, surpassing the 6% gain seen in September 2016.


Leave a comment