


XRP Price Eyes Breakout: What Traders Should Know
As traders await the results of today’s Bitwise XRP ETF launch, the price of XRP is tightening inside a breakout pattern. At the time of writing, XRP was trading at $2.12, up 0.56% over the previous day due to conflicting sentiment in the cryptocurrency market. The asset is still under pressure, having dropped 12.26% over the last 30 days and 14.47% during the previous week.
Activity is increasing despite the price decline. The 24-hour spot volume for XRP was $5.57 billion. Investors are returning to the market ahead of a major event, as evidenced by this 20% rise. Derivatives volume rose by 26% to $8.32 billion, according to CoinGlass data. In the meantime, open interest dropped to $3.71 billion, a 1.26% decrease. Reduced open interest and increased derivatives volume frequently suggest that traders are closing long-term contracts. They might be getting ready for short-term market turbulence based on this behavior.
Bitwise XRP ETF Debuts Today on NYSE
Today, November 20, is the official debut date of the eagerly anticipated Bitwise XRP ETF on the New York Stock Exchange. The ticker XRP will be used to trade it. Without requiring investors to possess the coin, the spot ETF offers direct exposure to XRP. Traditional institutions, asset managers, and pension funds that were previously constrained by regulatory obstacles now have more options. Bitwise first filed earlier this year, but the U.S. government shutdown delayed its planned October debut. The Securities and Exchange Commission’s 20-day automatic effectiveness window began on October 31 when the issuer revised its S-1. This action was intended to draw early capital inflows.
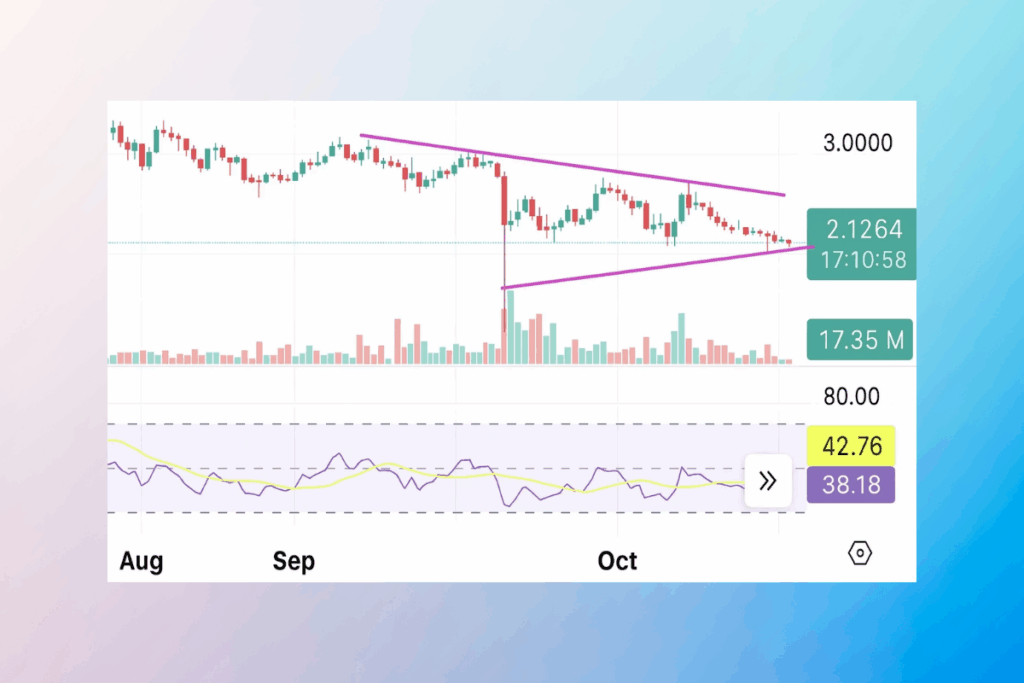
XRP Price Could Surge to $2.75 if Volume Picks Up
With lower highs and a progressively rising support line, XRP is compressing within a descending-triangle-to-symmetrical-triangle hybrid. This type of setup frequently leads to a significant move when the price deviates from the shrinking range. This is particularly true when a significant trigger takes place concurrently. The entire set of short-to-long-term moving averages, momentum, and the MACD is all negative. From the 10-day to the 200-day, every significant estimated moving average and basic moving average shows selling pressure. The price could rise toward $2.30 to $2.50 with a clear move over the declining trendline. It might then rise to $2.75 if volume increases.


For more up-to-date crypto news, you can follow Crypto Data Space.


Comments are closed.