


Ethereum Faces Critical Juncture: Key Levels Hint at Upcoming Volatility
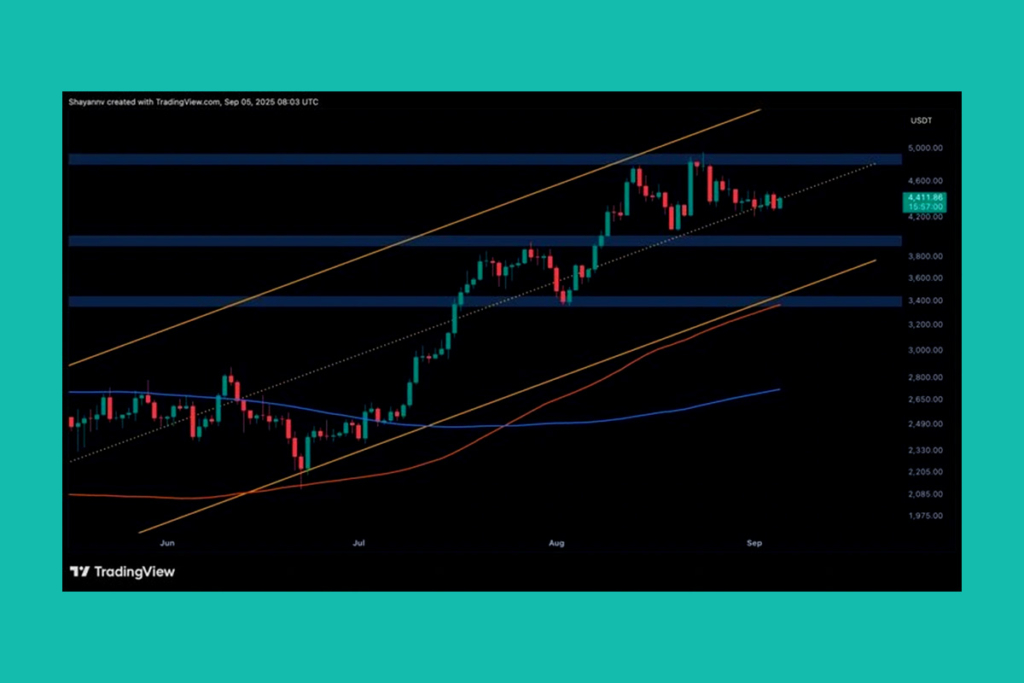
With price action still confined between significant support and resistance zones, Ethereum is still trading sideways with little volatility. The market is at a precarious point where a comeback or additional deterioration could materialize. ETH stays within its established upward channel on a daily basis. The price is currently stabilizing around the mid-range support after retreating from the upper boundary at $4.9K.
ETH Faces Critical Test in Descending Channel
As long as Ethereum stays above the $4.2K–$4.3K support area and the dotted trendline, the overall bullish channel structure will be maintained. However, if this sector were to disappear, deeper demand would be exposed in the $3.8K support zone. Bulls need to get back on track and push the price back toward the upper edge of the channel in order to regain control and aim for new highs.
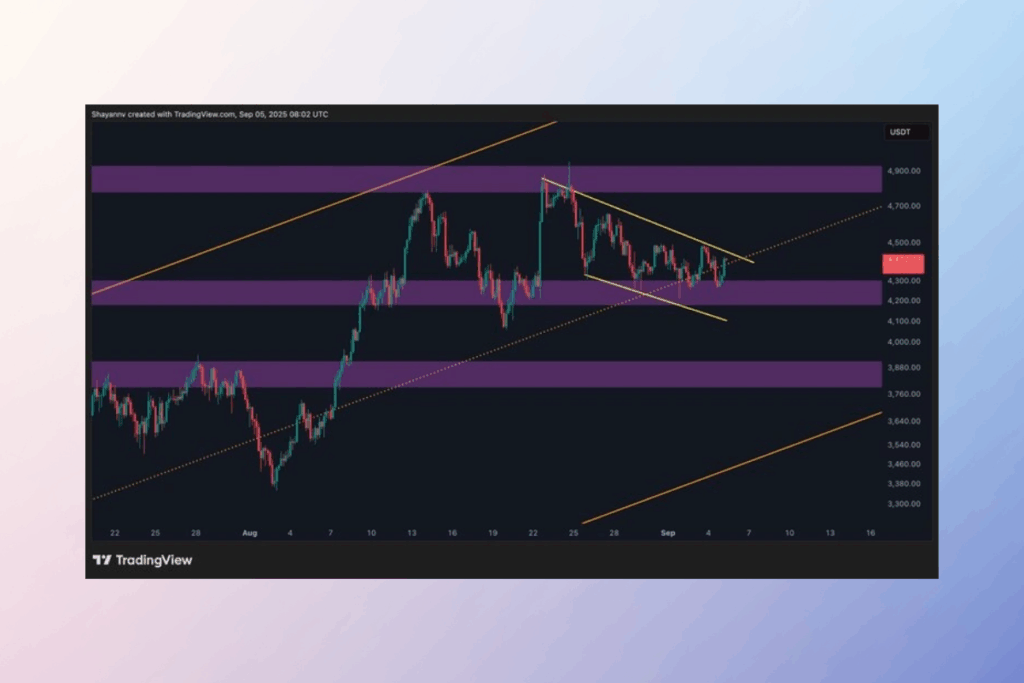
The compression, however, is more noticeable on the 4-hour chart. Since the steep decline around $4.9K, Ethereum has been trading in a downward channel (seen in yellow), with demand consistently present around the $4.2K support block. This descending channel’s upper boundary is presently being tested by the asset.
ETH Liquidity Clusters Signal Potential Breakout: Which Side Will Win?
With thick liquidity clusters building on both sides of the current price, the 2-week ETH/USDT liquidation heatmap shows a market that is compressed. The possibility of a liquidity-driven breakout in either direction is highlighted by this delicate, although well-balanced, setup. With leveraged bets heaped at both extremes, ETH is generally consolidating inside a tight range. Now, the $4,200 and $4,500 levels serve as crucial trigger points, and the next big move will probably depend on which side breaks first. Traders should exercise caution until then because the market is still susceptible to false breakouts and liquidity hunts.


For more up-to-date crypto news, you can follow Crypto Data Space.


Comments are closed.