XRP Price Facing Major Downturn: Can It Hold Above $1.32 in April, or Will It Break Down?

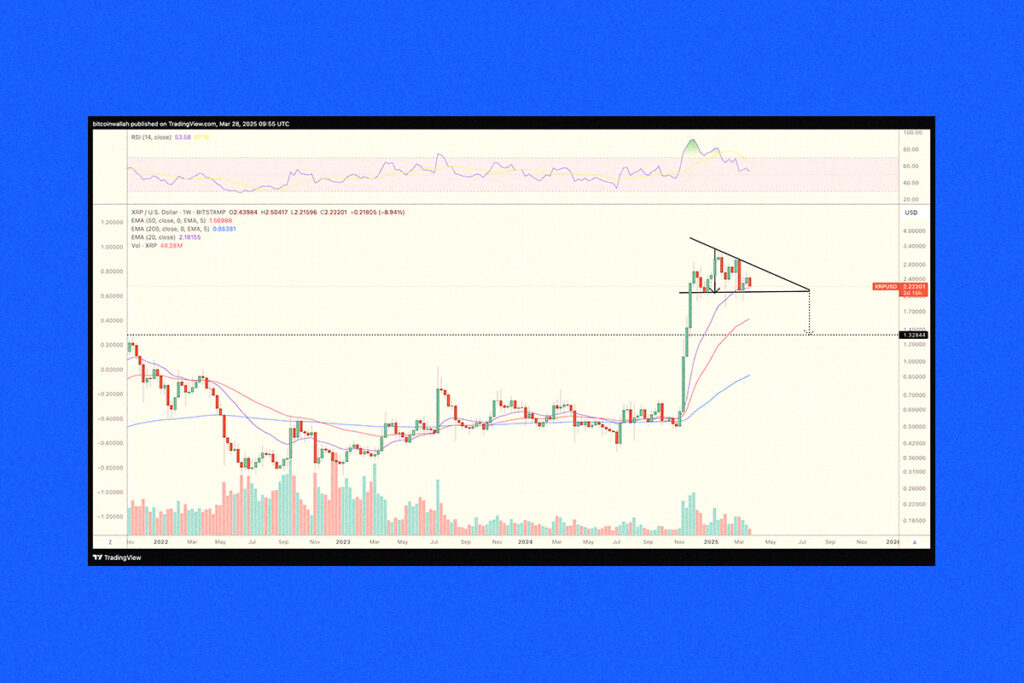
With a bearish technical pattern emerging on its weekly chart and macroeconomic pressures from expected US tariffs in April, the XRP market is displaying danger signs. Following a significant uptrend, a descending triangle pattern is interpreted as a bearish reversal indicator. The setup usually ends when the price drops as much as the triangle’s maximum height and breaks below the flat support level.
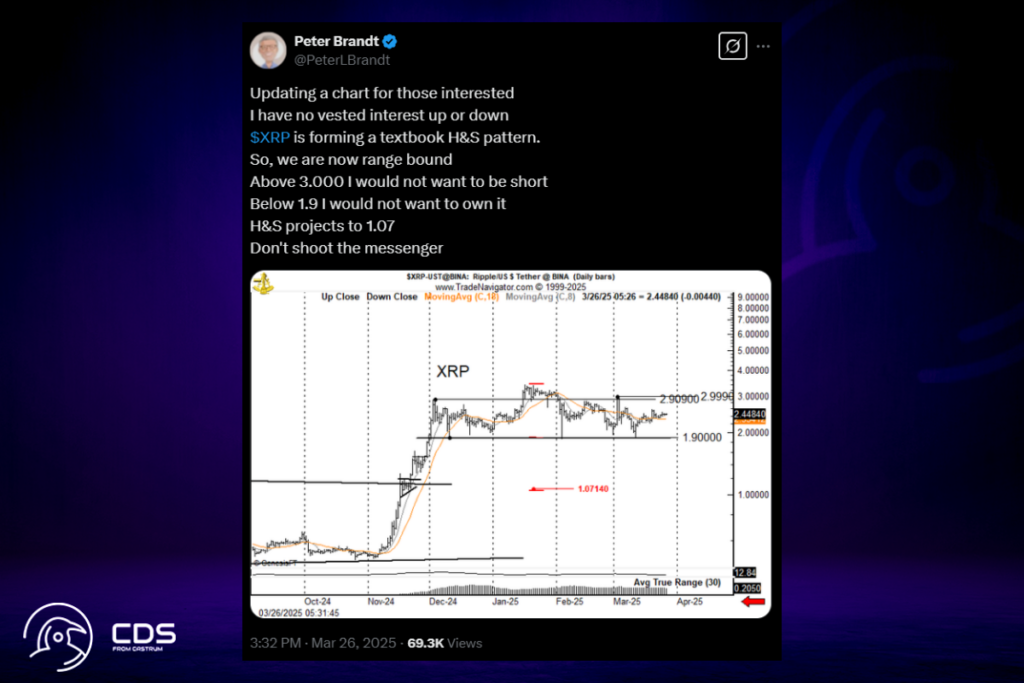
Triangle’s support for a possible breakdown move was being tested by XRP on March 28. In this scenario, the price may drop 40% from the current levels and reach the downside objective in April at about $1.32. The falling triangle objective for XRP confirms what seasoned trader Peter Brandt predicted. He cautioned that a textbook head-and-shoulders pattern appearing on the daily chart could cause the price to drop as low as $1.07.

Breakout or Breakdown? Critical Price Levels for XRP
The price might go toward its upper trendline at about $2.55, on the other hand, if it recovers from the triangle’s support level. The price could move toward the previous high of $3.35 if there is a clear breakout over this resistance level, which could invalidate the bearish formations completely.
Meanwhile, the larger market has become more cautious in reaction to President Donald Trump’s 25% vehicle import tariffs, which are scheduled to take effect on April 3. Both US consumers and manufacturers are likely to see price increases as a result of these levies.
For more up-to-date crypto news, you can follow Crypto Data Space.


Leave a comment