Trump Liberation Day Looms: Will Bitcoin Surge or Sink Next?

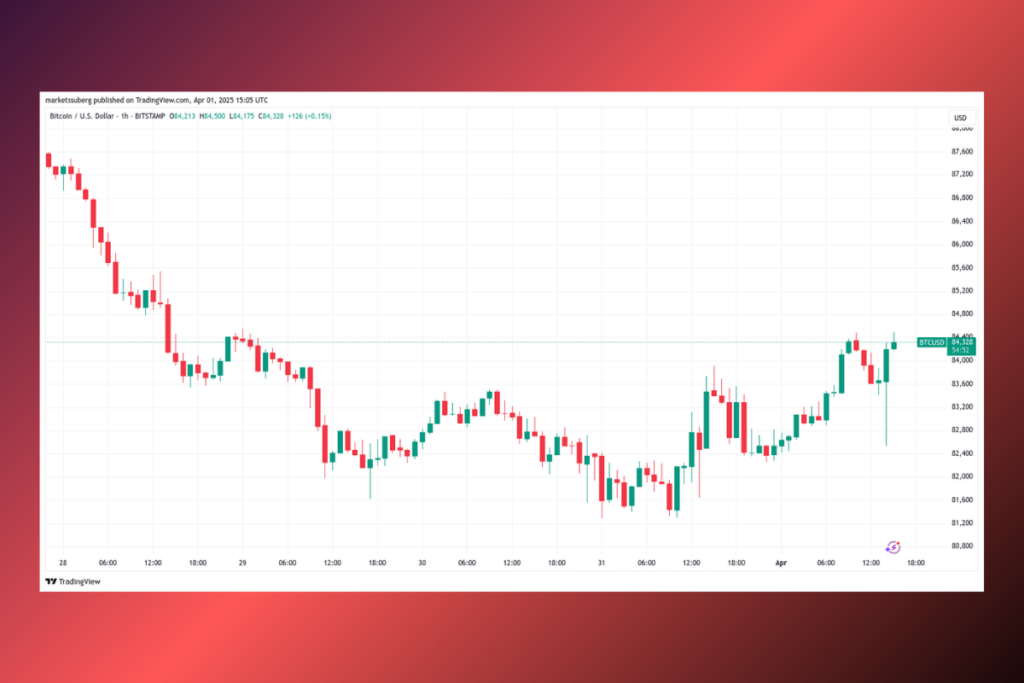
At the April 1 Wall Street opening, Bitcoin replicated its previous volatility as markets remained uneasy due to US trade tariff discussions. BTC/USD was moving quickly within its weekly trading range of about $83,000, according to data from Cointelegraph Markets Pro and TradingView. At the opening, US stocks declined slightly, and gold hit new all-time highs of $3,149 an ounce. Ahead of US President Donald Trump’s alleged Liberation Day, which is scheduled for April 2 and during which he has pledged to announce a new round of trade tariffs, the topic of the recession started to resurface.
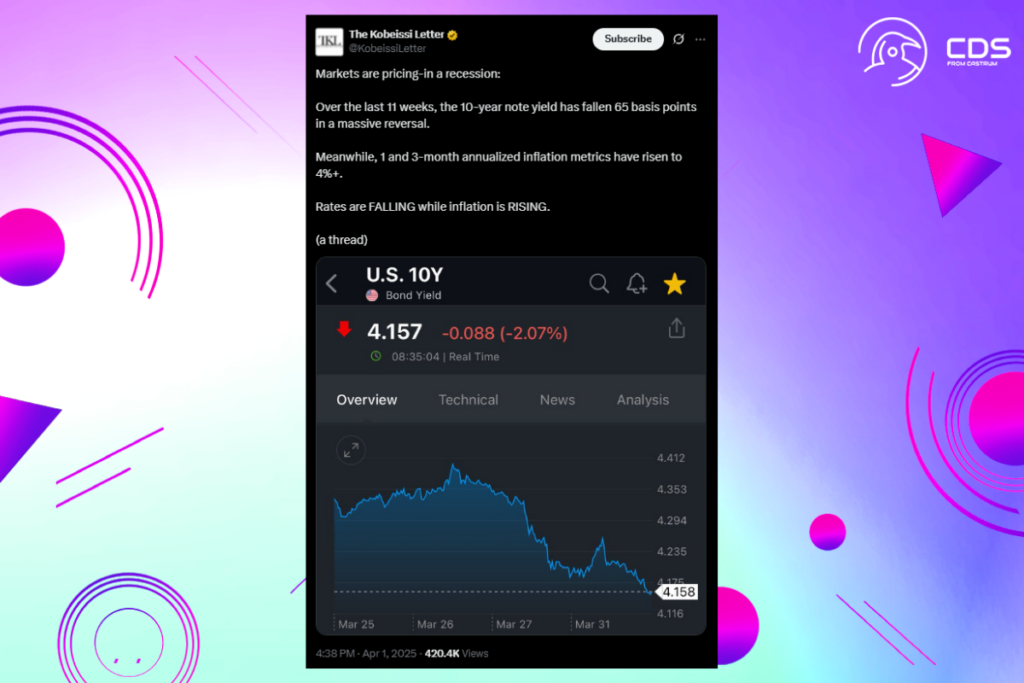
Equity markets are clearly pricing-in a recession: The S&P 500 is down -2% since Fed rate cuts began in September 2024,
trading resource The Kobeissi Letter
Recession Fears Loom as Fed Pauses Rate Cuts

Kobeissi referred to the Federal Reserve‘s easing of financial policy through interest rate reduction, which is now on hold but that markets anticipate will resume in June, according to data from CME Group’s FedWatch Tool. Although Kobeissi pointed out that history had not supported robust equities rebounds in such situations, this would be an obvious bullish stimulus for risk assets and cryptocurrency.
In the case of rate cuts during a recession, the S&P 500 declined -6% in 6 months -10% within 12 months. The AVERAGE post-pivot return is +1% in 6 months.
Kobeissi
Because of macroeconomic factors, trading company QCP Capital was also worried about the state of the market as a whole.
With consumer confidence plumbing 12-year lows and equity markets already rattled by a 4-5% weekly drawdown, the timing couldn’t be worse. There is a real risk that a broad and aggressive regime could deepen recession fears and send risk assets spiraling. That said, political theatre often leaves room for recalibration. A softer-than-expected rollout could offer markets a brief reprieve.
QCP Capital
BTC Price Action Stalls: Is a Breakout to $84.5K Still Possible?

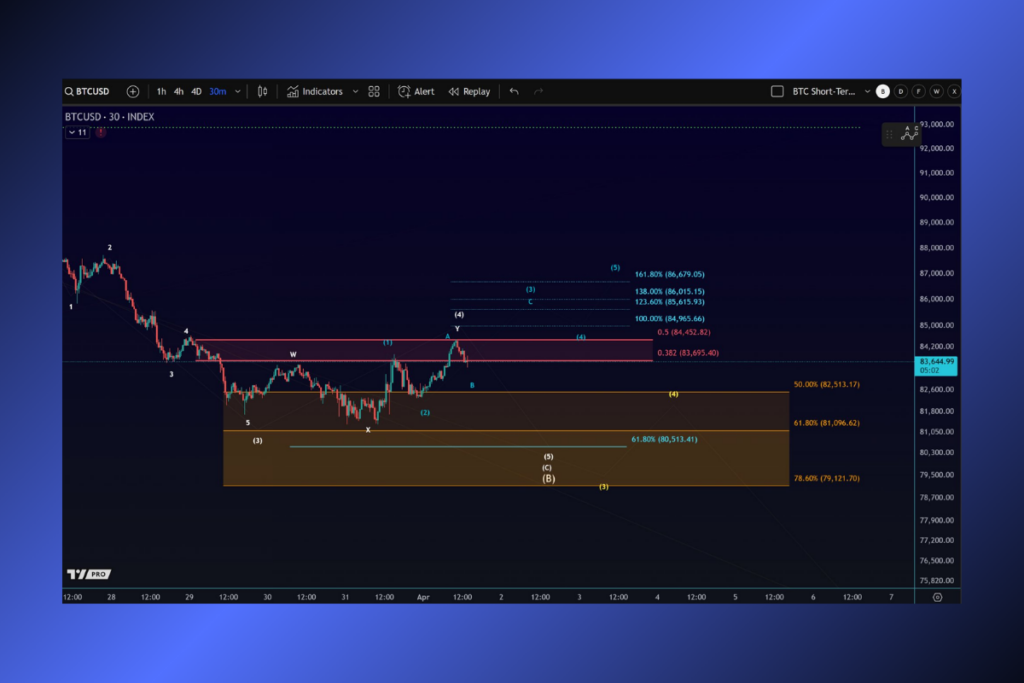
Market watchers were therefore eager for more robust indications than momentum in the Bitcoin price motion, even though the fundamental support level at $80,000 remained stable. Although there has been some upward movement today, the trading channel is still only three waves long, and resistance is still holding firm. The surge has more to prove, according to a summary of an Elliott Wave schematic for the 30-minute chart published by More Crypto Online.
According to well-known trader Jelle, the 50-week simple moving average (SMA), which is currently at $76,600, is being respected by the BTC/USD pair as support. He believed that Bitcoin, which had been rejected there earlier in the day, would regain $84,500 as its next leg up.
For more up-to-date crypto news, you can follow Crypto Data Space.


Leave a comment