Polkadot Price Prediction- DOT Surges Above $8, What’s Next?
Polkadot Price Prediction– Polkadot (DOT) has experienced a remarkable price surge, skyrocketing by over 100% in the past month. After a lengthy downtrend, the cryptocurrency broke out of its bearish channel, signaling a potential recovery. DOT has now returned to the $8 level, which was a resistance turned support in earlier cycles. This shift in price dynamics is crucial, as it sets the stage for further gains. The recent rally highlights increased bullish sentiment in the market, with DOT’s price surging more than 35% in just one day.
Polkadot Price Breaks $8 Resistance: Key Levels to Watch
Over the last 30 days, Polkadot has made an impressive recovery, surging by 111%. This rally includes a significant 40% jump in a single day, pushing DOT back above the $8 threshold. Once a resistance level, this price point has now turned into support, signaling that the bulls are in control. As of now, the $8 mark plays a crucial role in maintaining the upward momentum.
Polkadot’s price is moving toward a key resistance level near $10, which also represents a psychological barrier for traders. The $10 zone has acted as both support and resistance in previous market cycles, making it a critical level to monitor. If Polkadot successfully breaches this resistance, it could trigger a rally toward the next target around $12.60.

On the daily chart, the Relative Strength Index (RSI) has recently entered the overbought zone, reflecting a surge in buying activity. This is a strong indication that the market favors further upward movement. However, traders must remain cautious, as overbought conditions often precede short-term price corrections.
Technical Indicators Suggest Bullish Momentum for DOT
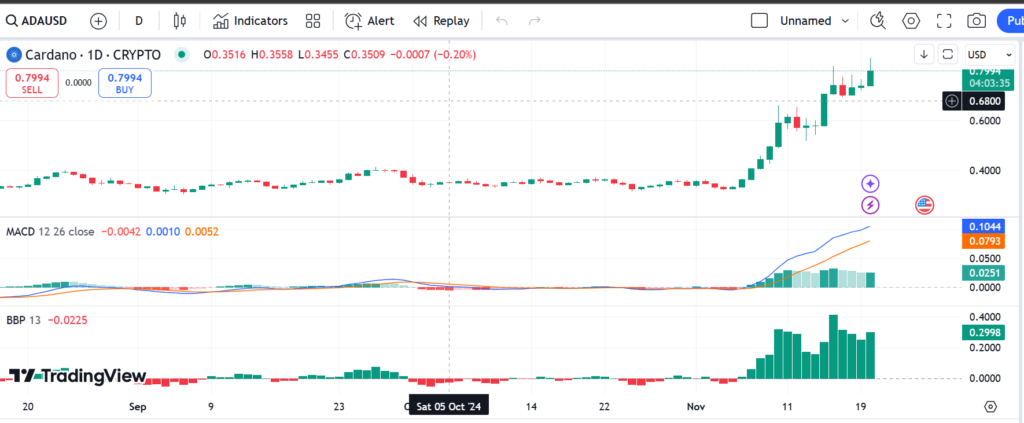
Polkadot’s recent price movements have been supported by strong bullish technical indicators. The Moving Average Convergence Divergence (MACD) has shown a powerful bullish crossover, with the MACD line now moving significantly above the signal line. This indicates a robust bullish trend, with increasing buying pressure that could keep Polkadot’s price on an upward trajectory.
Additionally, the histogram bars on the MACD are rising, confirming that the momentum is leaning toward the bulls. The increasing trading volume and market activity further strengthen the case for a continuation of this uptrend. At the time of writing, Polkadot is trading at $8.53, having surged by 35.65% within 24 hours, with a market capitalization of $13.14 billion and a trading volume of $3.03 billion — a massive 271% increase from previous levels.
Will Polkadot Reach the $10 Level?
Experts are optimistic that if the current upward momentum continues, Polkadot could easily reach the $10 mark in the coming days. The $9.91 level is the next immediate resistance, and breaking through this could lead to a push above $10. A rising Simple Moving Average (SMA) on the daily chart further supports this bullish outlook, as it suggests a strong positive trend for DOT and the broader cryptocurrency market.
However, while the bullish case remains strong, caution is advised. A bearish reversal could lead to a pullback, potentially testing the $6.57 support level. In the worst-case scenario, a deeper correction could push Polkadot’s price back toward its critical floor of $5. Analysts have stressed the importance of Polkadot closing the month above $8.61 to maintain the current bullish momentum and avoid a potential retracement.
The increasing volatility in the market is expected to play a crucial role in determining whether Polkadot can continue its bullish run. If the buying pressure remains strong, it is possible that DOT will not only break through the $10 resistance but could even set its sights on $12.60.
Polkadot’s Recovery and Potential Future Price Action
Polkadot’s price surge over the past month signals a major recovery after a prolonged downtrend. The cryptocurrency has successfully broken through the $8 resistance level, which is now acting as support, and is on track to challenge the $10 mark. With strong technical indicators, including the MACD crossover and RSI reaching overbought levels, the future looks promising for DOT.
However, as with any market, volatility remains a significant factor. While the bulls dominate the current price action, a pullback or correction cannot be ruled out. Traders and investors should remain vigilant, keeping an eye on key levels such as $8 and $9.91, while also considering the possibility of a deeper correction if the market sentiment shifts.
Overall, Polkadot’s recent price action reflects the growing confidence in its long-term potential, driven by strong fundamentals and technical factors. As Polkadot continues to gain traction, it is likely to remain a key player in the broader cryptocurrency market, potentially breaking new price milestones in the months ahead.


Leave a comment