Dogecoin Price Forecast: What’s Next After Breaking the $0.46 Resistance?
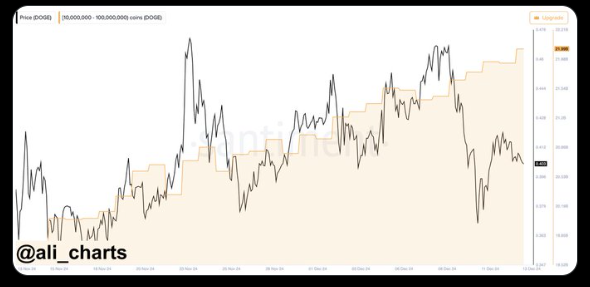
Dogecoin Price Surge – Dogecoin (DOGE) has recently experienced a surge in buying activity, with DOGE whales acquiring an impressive 160 million DOGE within a 24-hour period. This large-scale accumulation has contributed to an overall boost in market sentiment, with many investors remaining optimistic about the potential for further price increases.
The influx of whale purchases comes at a crucial moment, as Dogecoin has broken through the critical $0.46 resistance level. This move has sparked bullish predictions, with analysts eyeing $0.50 as the next key target and the previous all-time high (ATH) of $0.7376 as a potential milestone. If this upward trend continues, the $1 threshold could be within reach, leading to even more excitement for Dogecoin investors.

Dogecoin Price Analysis: MACD and RSI Indicators Show Bullish Momentum
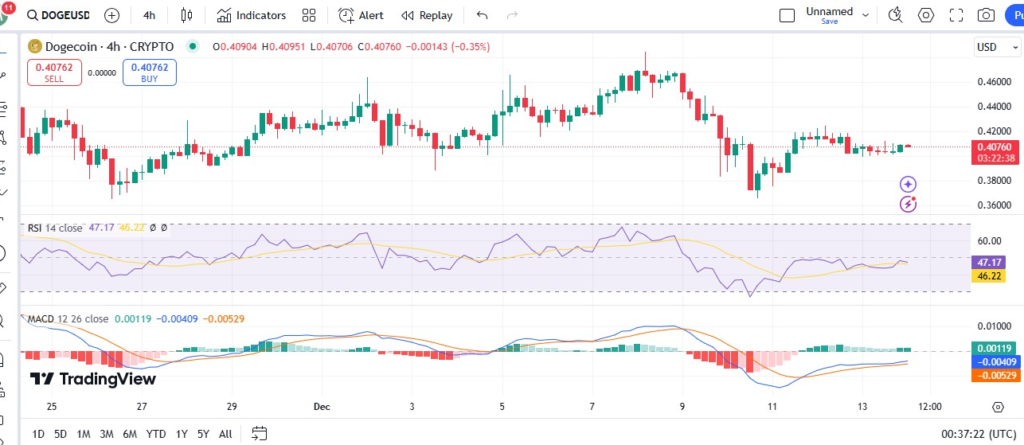
Technical indicators are reinforcing the positive outlook for Dogecoin‘s price. The Moving Average Convergence Divergence (MACD) has shown signs of recovery, with the MACD line crossing above the signal line, a key signal of bullish momentum. Additionally, the MACD histogram indicates a reduction in bearish strength, suggesting that an upward move could be imminent.
Another important indicator, the Relative Strength Index (RSI) on the 4-hour chart, stands at 47.91, just below the neutral 50 mark. While this suggests a balance between buying and selling pressures, it also signals that the market remains in a consolidation phase. This phase of indecision could lead to either a bullish breakout or continued sideways movement, depending on future market dynamics.
Double-Bottom Formation Suggests Potential 85% Rally for Dogecoin
In addition to these indicators, technical analysis reveals that Dogecoin is forming a double-bottom pattern on its price chart. This pattern, often seen as a bullish signal, indicates that the cryptocurrency has tested a key support level, around $0.37, twice before rebounding. The formation of a “W” shape on the chart is a sign of decreasing selling pressure and increasing buying activity.
If this pattern continues to unfold, Dogecoin could experience a potential 85% rally, surpassing its previous all-time high and reaching new heights. The $0.46 resistance level has already been breached, and if the momentum continues, Dogecoin could be poised for even greater gains in the coming weeks.
Current Market Overview: DOGE Price and Trading Volume
At the time of writing, Dogecoin is trading at $0.41, marking a 2% increase in the past 24 hours. The 24-hour price range has fluctuated between $0.4005 and $0.4128, reflecting moderate volatility. The trading volume stands at $3.52 billion, although it has decreased by 27% over the past day. Despite this drop in volume, the overall market sentiment remains positive, with many investors keeping an eye on Dogecoin‘s potential for future growth.

Conclusion: Bullish Indicators Suggest Dogecoin Could Reach New Heights
As Dogecoin whales continue to accumulate large amounts of DOGE, and with technical indicators pointing toward increasing bullish momentum, the outlook for Dogecoin remains strong. The MACD and RSI suggest a potential breakout, while the double-bottom pattern offers hope for a significant price rally. With the price already surpassing the $0.46 resistance level, Dogecoin could be on the verge of further gains, potentially reaching the highly anticipated $1 mark.
For investors looking to capitalize on Dogecoin‘s recent momentum, monitoring key levels such as $0.46, $0.50, and the previous ATH of $0.7376 will be crucial in determining the next steps for this rapidly evolving cryptocurrency.
Disclaimer: This article is for informational purposes only and does not constitute investment advice. Cryptocurrencies and stocks, particularly in micro-cap companies, are subject to significant volatility and risk. Please conduct thorough research before making any investment decisions.


Leave a comment