TRON Price Analysis for November 14: Will TRX Reach 800% Gains by Year-End?
TRON (TRX) has recently neared its all-time high after a sharp surge on November 13, reaching $0.1825 before retracing slightly to its current price of $0.1813. This slight dip in price is accompanied by a significant decrease in daily trading volume, down by 46%, which may indicate profit-taking among some investors. However, the question remains: can TRX surpass its current resistance levels and achieve an ambitious 800% rise by year’s end?
Rising Whale Activity and What It Could Mean for TRX Price

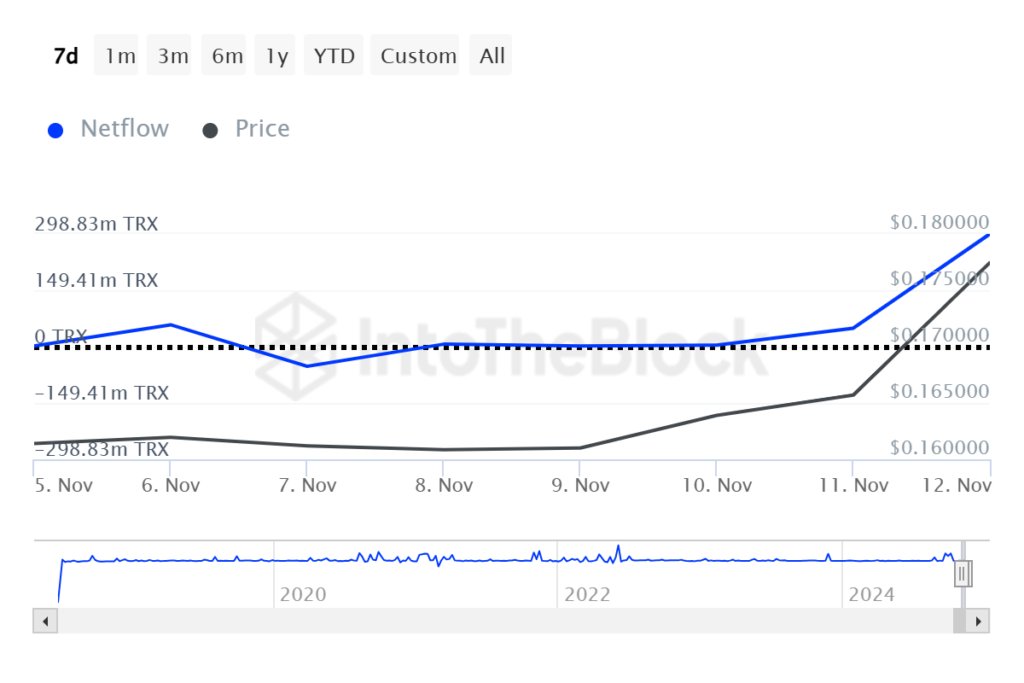
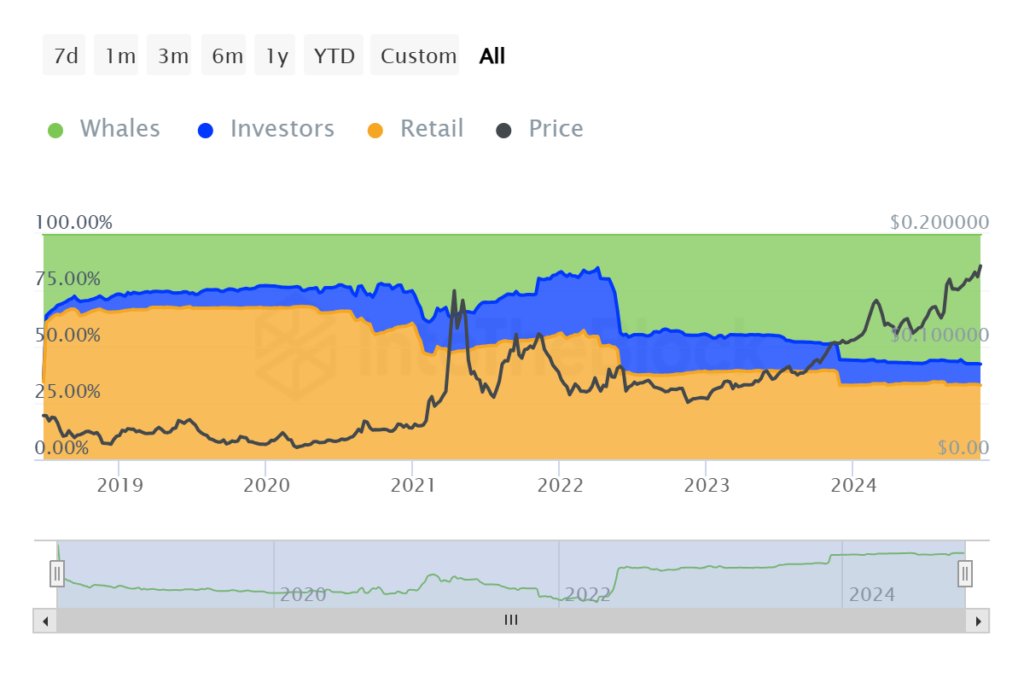
Recent data from IntoTheBlock (ITB) suggests that whale activity around TRON is intensifying, with a notable 458% increase in large TRX inflows over the past week. The share of TRX held by major investors has grown by 0.23% in the past month, while retail investors have reduced their holdings by 1.74%. These shifts indicate that longer-term, high-net-worth holders are entering the TRX market, likely anticipating sustained bullish movement in the near term.

Prominent crypto analyst Petrov has forecasted that TRX could reach $1.5 by May 2025, citing its current parabolic trend. His outlook aligns with the technical analysis suggesting that TRX might experience an 800% surge from its current levels.
Technical Analysis: TRX’s Bullish Pennant Pattern and Price Targets
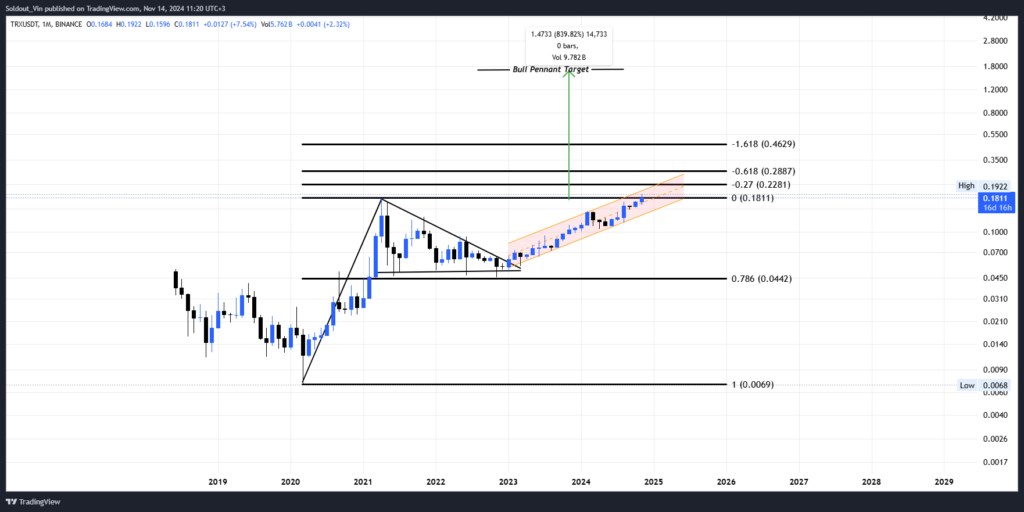
Analyzing TRX’s price chart reveals a strong bullish trend, highlighted by a recently broken bullish pennant pattern. This breakout suggests a continuation of the previous uptrend, further strengthened by TRX’s movement within an upward sloping channel. In Elliott Wave terms, the current impulsive wave structure points to higher price targets, with Fibonacci extensions indicating a potential peak at $1.68.
Short-term resistance is identified at $0.228 (Fibonacci -0.27 level) and $0.288 (Fibonacci -0.618 level), with major resistance at $0.462 (Fibonacci -1.618 level). The long-term bull pennant target is set at $1.68, reflecting an 800% increase from TRX’s current price.
On the downside, immediate support lies around $0.181, aligned with the lower boundary of the upward channel, while a more significant support level is at $0.044, corresponding to the Fibonacci 0.786 retracement level from previous lows.

TRX’s Potential Path to $1.68
TRON’s current technical setup, rising whale activity, and wave analysis point toward a bullish outlook with substantial upside potential. The recent price action and whale accumulation suggest that TRX may be gearing up for a significant rally, with an 800% gain possible if it can break through its resistance levels.
FAQ on TRON Price Analysis: Can TRX Reach 800% Gains by Year-End?
What caused TRON (TRX) to approach its all-time high recently?
TRON’s recent price surge is attributed to a bullish market trend that began on November 13, pushing TRX to $0.1825. However, the price then experienced a slight pullback to $0.1813, partly due to profit-taking among investors following the initial price spike.
What does the drop in daily trading volume mean for TRX’s price movement?
The 46% drop in daily trading volume indicates a decrease in market activity, which is often a sign of investors locking in profits. This lowered activity could imply potential consolidation or preparation for the next big move, depending on market sentiment and whale activity.
How has whale activity affected TRX’s price potential?
Recently, whale activity around TRON has surged significantly, with large TRX inflows rising by 458% over the past week. Additionally, whale holdings of TRX increased by 0.23% in the last 30 days. This accumulation by large investors suggests that whales are positioning for a possible price surge, often indicating bullish market sentiment.
What are the key technical indicators that suggest an 800% rise for TRX?
The TRX price chart displays a bullish pennant formation, a technical indicator that suggests a continuation of the upward trend. Additionally, the price is within an ascending channel, and Fibonacci extensions support higher targets, with the final target set around $1.68.
Are there any key resistance levels for TRX in the short term?
Yes, TRX faces short-term resistance levels at $0.228 (Fibonacci -0.27 level) and $0.288 (Fibonacci -0.618 level). The major resistance level to watch is $0.462, corresponding to the Fibonacci -1.618 level.
Where are the major support levels for TRX if the price declines?
Immediate support is located at $0.181, which aligns with the lower boundary of the ascending channel. A more substantial support level lies around $0.044, based on the Fibonacci 0.786 retracement from previous lows.
What are the predictions from crypto analysts regarding TRX’s price?
Crypto analyst Petrov has predicted that TRX could reach $1.5 by May 2025, given its current parabolic trend and technical indicators. This prediction aligns with the general market outlook suggesting a strong upward trajectory for TRX in the longer term.
What does Elliott Wave theory suggest for TRX’s future price movement?
According to Elliott Wave theory, the current pattern may represent an impulsive wave, which could drive TRX’s price significantly higher. With Fibonacci extensions indicating a possible peak at $1.68, this theory supports the prospect of an 800% price increase in the longer term.


Leave a comment