Solana (SOL) Faces Bearish Pressure as Technical Indicators Signal Range-Bound Trading
Solana (SOL) hasn’t enjoyed much positive momentum in its price trajectory lately. It encountered resistance around $160, stemming from a higher timeframe imbalance, and has since settled into a range-bound pattern.
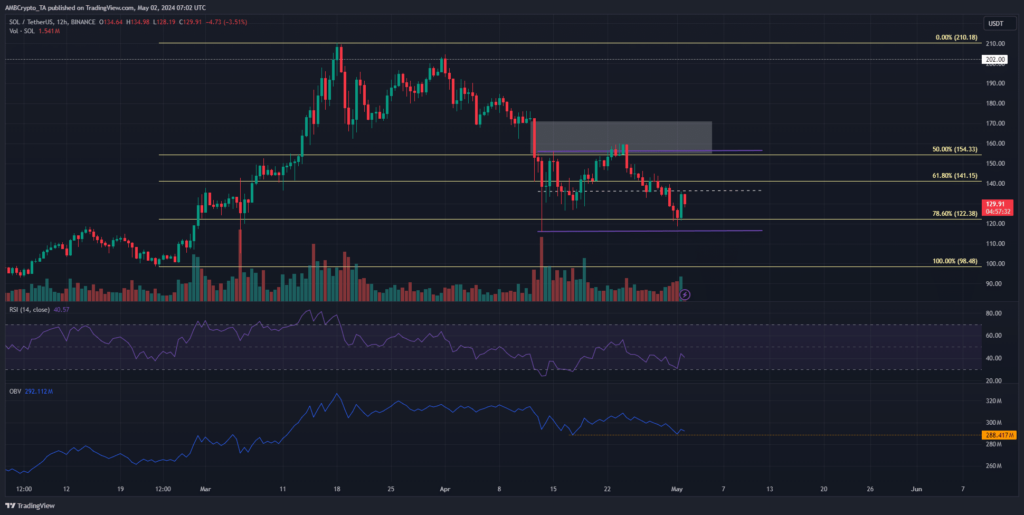
This range spans from $156 to $116.3, with technical indicators signaling a bearish bias. A recent report by AMBCrypto shed light on the concerning Open Interest situation behind SOL, further accentuating its bearish prospects.

The midpoint of this range, pegged at $136.6, appears to be SOL’s current target as it gravitates towards a retest, likely to face resistance in the near term.
On the 12-hour chart, the RSI remains below the neutral 50 mark, indicating a prevailing bearish momentum with a reading of 40.57. The OBV has been on a gradual decline throughout the latter half of April, albeit showing a slight rebound in the past couple of days.

A breach of the OBV support would signify strengthening selling pressure on SOL, potentially driving prices below the range lows at $116. As per the internal structure analysis, $122 emerges as a critical support level for Solana’s price.
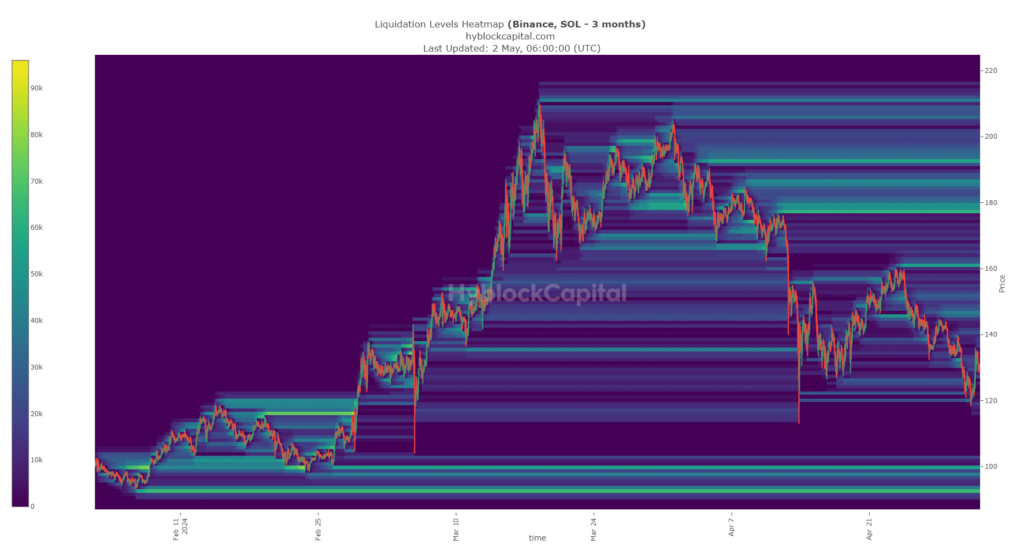
There’s an underlying sense of fear in the market, exemplified by the movement to $116 on April 13th, followed by a rebound that suggested liquidity around $120 had already been absorbed.
Presently, the next significant liquidity pool is positioned around $100, while resistances to the upside lie at $160 and $145.
Considering the price action dynamics and technical indicators, a descent towards $100 or even $92 wouldn’t come as a surprise.


2 Comments