Solana Price Dips 0.83% on Low-Volatility Sunday, Trading at $155.44 Amid Renewed Selling Pressure
Solana (SOL) experienced a slight 0.83% decline today, with the price now sitting at $155.44. This downward movement follows substantial selling pressure, partly driven by sales from the Pump.fun fee account, as well as a natural market correction after a three-week bullish run. The key question now is whether this bearish reversal will deepen or if buyers are waiting to capitalize on a dip.
Will Pump.fun’s $18.9M SOL Sell-Off Delay Solana’s Breakout to $200?
Data from blockchain analytics platform Lookonchain reveals that the Pump.fun fee account has sold off 122,250 SOL (roughly $18.9 million) in the past five days. In total, the account has generated 773,617 SOL (around $120.68 million) in revenue, with 398,313 SOL (worth $62.13 million) sold so far.
Although these sales may introduce short-term volatility and a possible pullback in Solana’s price, the transaction volume reflects growing activity on the network. As demand for Solana’s blockchain continues to rise, such large-scale transactions indicate the network’s expanding impact, which could support long-term growth for SOL.
SOL Price Signals a Brief Pullback Before a Potential Rally
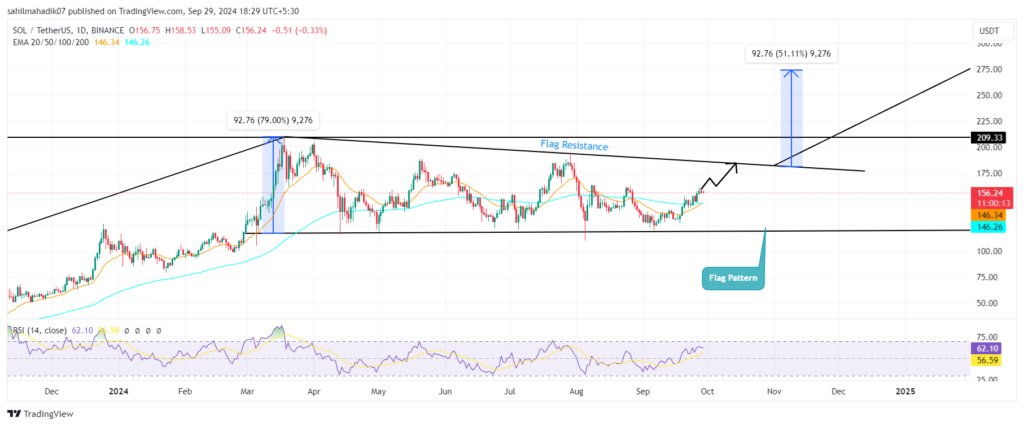
In the past week, Solana price saw a steady recovery, rising from $142 to $156, marking a 10.4% increase. This buying momentum extended a V-shaped recovery on the daily chart, suggesting a shift in market sentiment.
Typically, sharp price increases are followed by brief corrections, and the current sell-off by Pump.fun aligns with this pattern. However, if Solana retraces to the 20-day exponential moving average, coupled with a bullish crossover of the 100-day EMA, the upward trend could resume. Continued buying pressure might push SOL up 17.6%, targeting a breakout from a bull-flag pattern. A successful breakout could see prices soar 51% to reach $275.

On the downside, an extended correction could delay Solana’s attempt to break the $200 barrier, with the price retesting the flag support trendline—an accumulation zone since March 2024.


Leave a comment