Exploring the Meme Coin Madness: How Did SHIB, BONK, and WIF Perform This Week?
The meme coin market has seen a significant uptick after suffering losses for a week. Shiba Inu and Bonk, two popular meme coins, have seen double-digit increases in value during the last seven days. Dogwifhat, a Solana-based meme coin, defied the trend throughout the same time period, seeing a decrease.
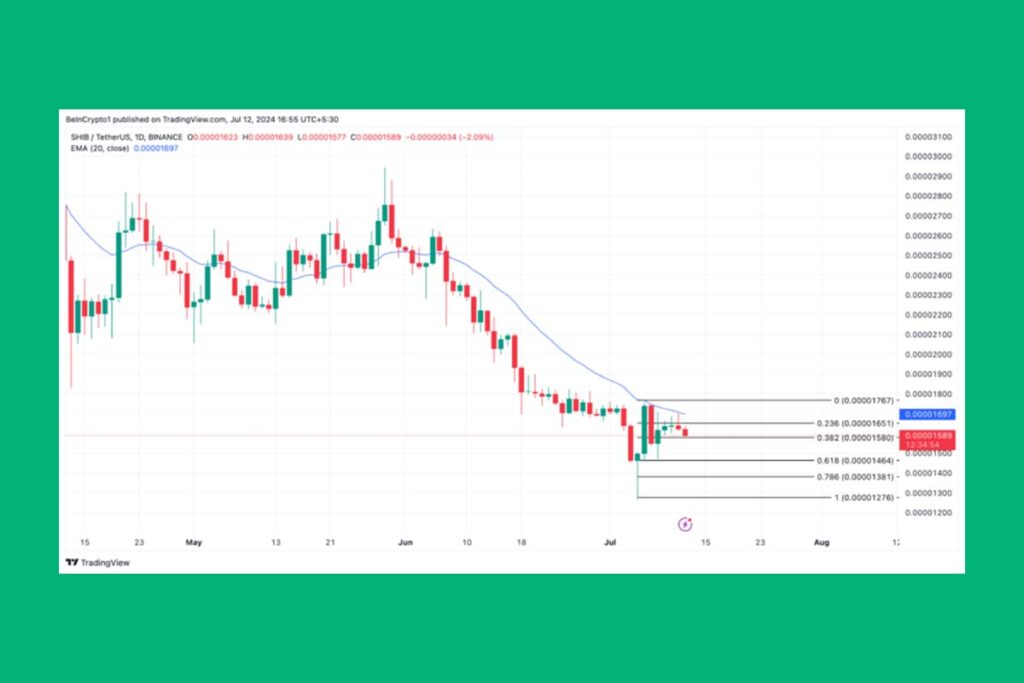
Shiba Inu (SHIB) Price Rally: 9.40% Increase and Possibility to Exceed EMA 20

Over the past week, there has been a 9.40% increase in the price of the SHIB coin. The meme currency is trading at $0.00001688 as of this writing. When seen as a one-day chart, the coin’s price is about to surpass its exponential moving average (EMA) of 20 days.
A cross of this important moving average by the price of an asset is a bullish indication. As for SHIB, it has been trading below the 20-day moving average since June 7. Because it suggests a change in the momentum towards purchasing and maybe higher prices, the move to rally above it is noteworthy.
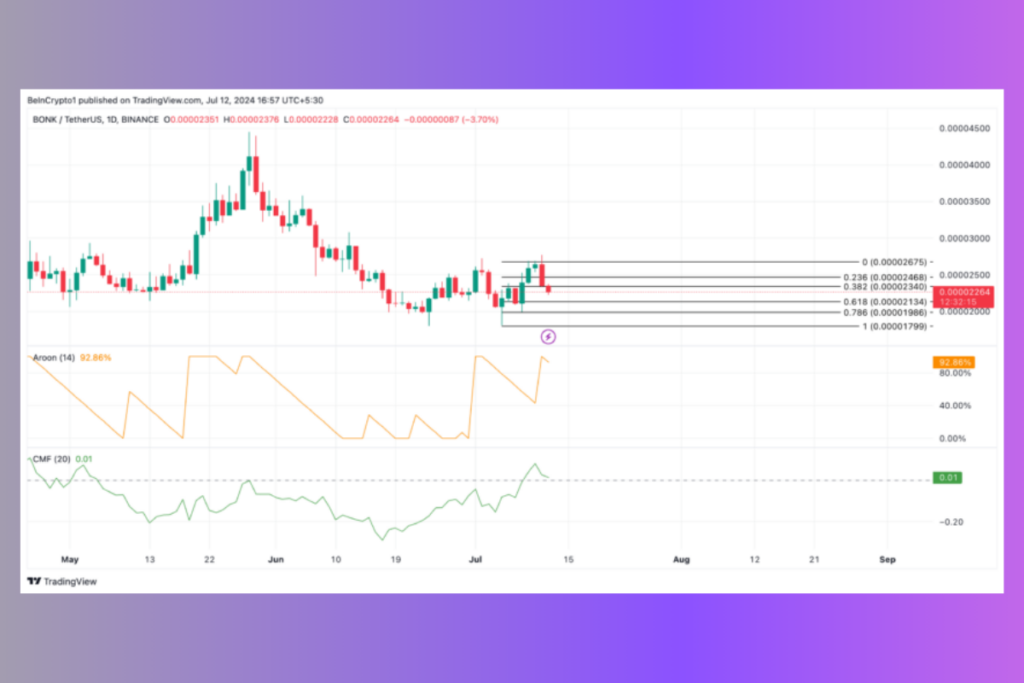
Bullish Signals in the Bonk (BONK) Market: 2.69% Increase and Strong Aroon Up Line

BONK is currently trading at $0.0000228. Its price increased by 2.69% over the course of the review week. The Aroon Up Line for BONK is at 92.86%, confirming the strength of the current uptrend. A further indication of liquidity entry into the BONK market is the token’s positive Chaikin Money Flow (CMF). For the price rally to continue, this is required. BONK’s CMF was 0.02 on the last day.
Dogwifhat (WIF) May Fall For A While

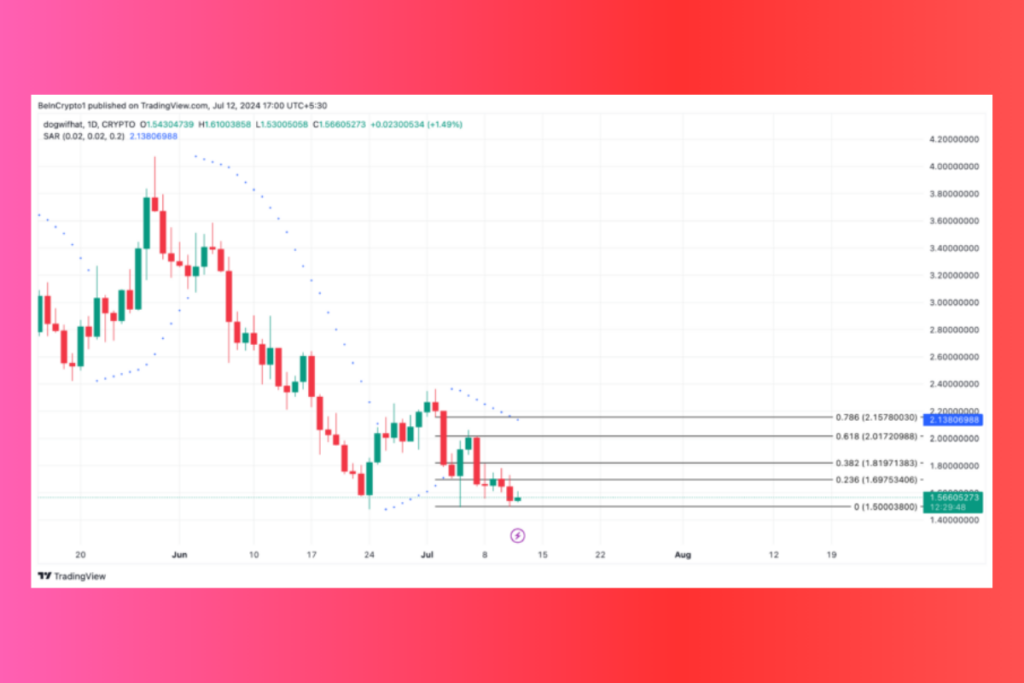
The only meme coin that has seen a price decrease in the past week is Dogwifhat (WIF), which is ranked fifth by market capitalization. At the time of writing, the dog-themed coin was trading for $1.59; over the previous week, its value had decreased by 19.82%.
The Parabolic Stop and Reverse (SAR) signal readings from WIF indicate that there is a possibility that the price decrease may continue through the weekend. This shows that the meme coin’s negative feelings are still very much present. The market is likely to continue declining as the indicator’s dots are above their price at the time of publication.
FAQ
What is the Aroon Indicator?
The Aroon indicator of an asset determines probable price reversal points and assesses the strength of the trend. When the Aroon Up Line is at 100, it signifies a robust uptrend and a moderately recent peak reached.
What Does a Moving Average Do?
An asset’s short-term trends are evaluated by the moving average, which also suggests possible entry and exit locations. Over the last 20 days, it calculates the average market price of an asset.
What is the CMF Indicator?
The money flow into and out of a market is gauged by an asset’s CMF indicator. Since asset holders provide the capital to support price rises, a value above zero indicates a strong market.
What Does a Parabolic SAR Do?
One tool for determining possible trend direction and reversals is the Parabolic SAR indicator. There is strong selling pressure on an asset when its dotted lines are positioned above its price.
For more up-to-date crypto news, you can follow Crypto Data Space.


Leave a comment