Crypto News– The Bitcoin (BTC) price closed out September on a bullish note, marking a nearly 5% increase for the month. As October began, a significant price surge took place, which is currently ongoing.
Bitcoin Price Recovers as September Draws to a Close – Can October Sustain the Positive Momentum?
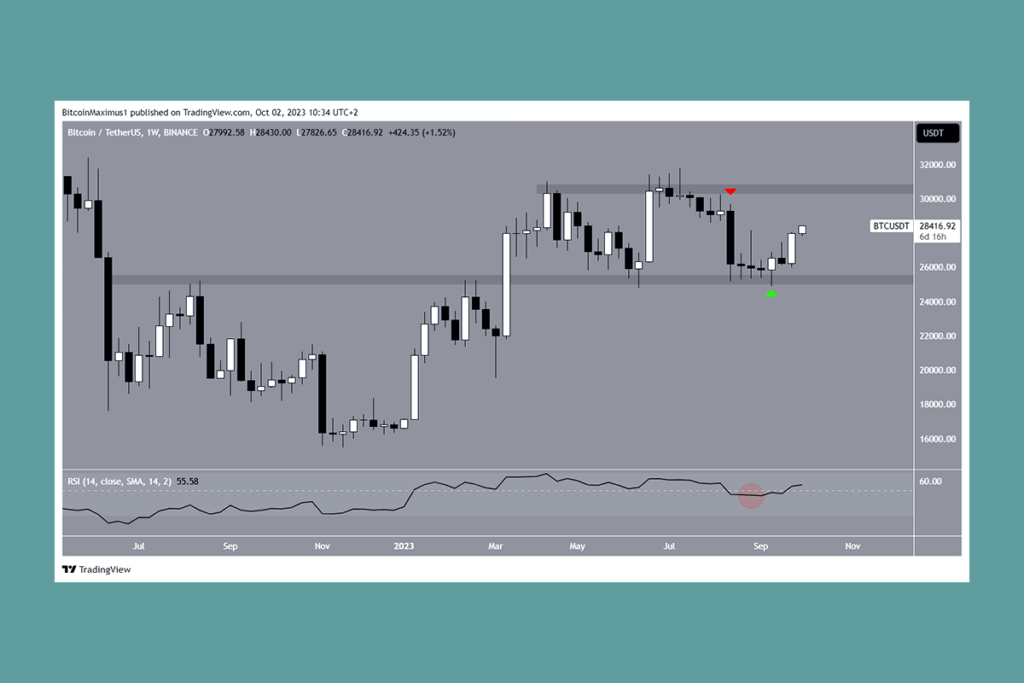
A closer look at the technical analysis on the weekly timeframe reveals that BTC’s price has been on the rise since the week starting September 11. This upward movement confirmed the $25,300 horizontal area as a reliable support level. The bullish momentum continued to accelerate throughout the past week, resulting in the formation of a bullish engulfing candlestick pattern.

A bullish engulfing candlestick is characterized by completely erasing all the losses from the previous period, signaling a positive outlook for future trends. However, it’s important to note that despite this bounce, Bitcoin has not yet fully recovered the losses from the sharp drop that occurred on August 17, marked by a bearish engulfing candlestick. This particular candlestick pattern began at $29,200, slightly below the key horizontal resistance area at $30,500.

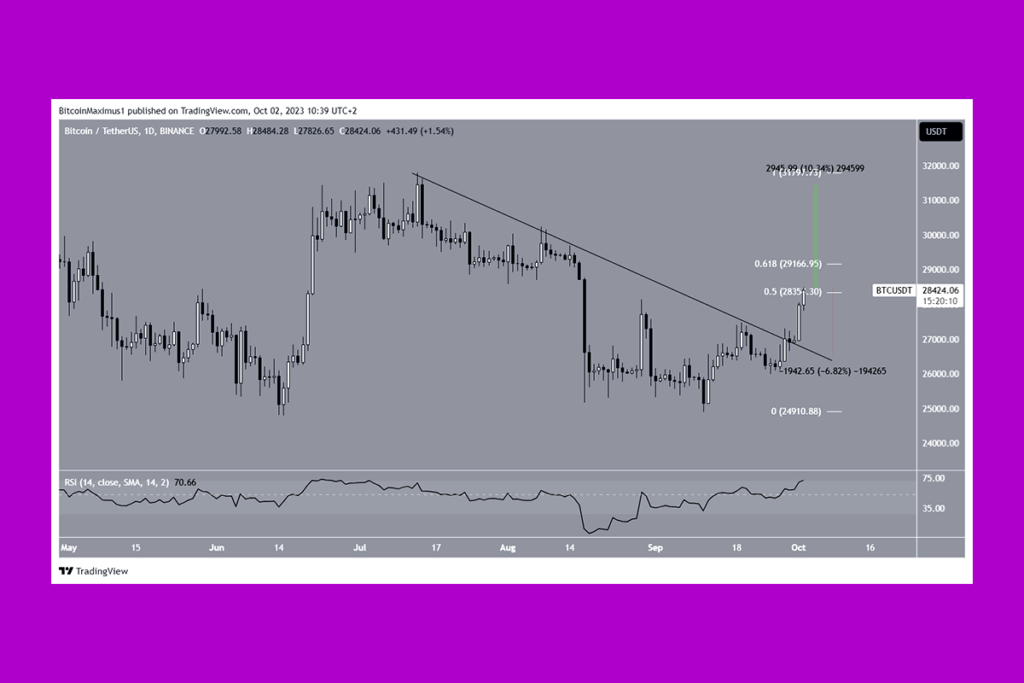
Analyzing the daily timeframe also reveals a bullish scenario for Bitcoin’s technical outlook. The price of Bitcoin broke out of a descending resistance trendline, indicating that the previous correction phase may be over.
Currently, BTC is trading within the 0.5 to 0.618 Fibonacci retracement resistance range, situated between $28,350 and $29,150. Whether Bitcoin manages to surpass this range or faces rejection will be pivotal in determining the future trend.


Leave a comment