Crypto chart patterns are technical analysis tools that traders use to identify potential price movements in cryptocurrencies. These patterns are formed when prices move in a particular way and create specific shapes on a chart. Understanding crypto chart patterns can help traders make more informed trading decisions and increase their chances of profiting from the market.

Crypto Chart Patterns Explained
Here are some of the most common crypto chart patterns:
- Head and Shoulders: This pattern is identified by three peaks, with the middle peak (the head) being higher than the other two (the shoulders). It typically indicates a trend reversal, with prices expected to move lower.

- Double Bottom: This pattern is formed when prices reach a low, bounce back up, and then return to the same low. It suggests that prices may be bottoming out and could soon move higher.
- Double Top: This pattern is the opposite of the Double Bottom, where prices reach a high, drop back down, and then return to the same high. It suggests that prices may be topping out and could soon move lower.

- Triangle: Triangles are formed when prices move in a narrowing range, forming either an ascending or descending triangle. An ascending triangle suggests that prices may break out to the upside, while a descending triangle suggests that prices may break out to the downside.

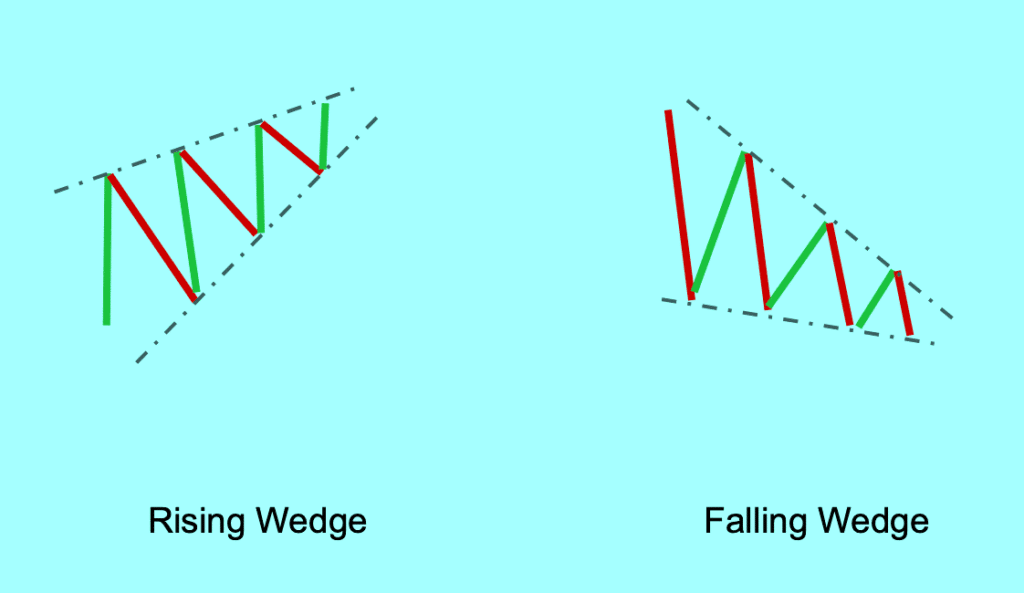
- Wedge: Similar to triangles, wedges are formed when prices move in a narrowing range. However, the difference is that wedges can either be upward sloping (bullish) or downward sloping (bearish). Upward sloping wedges suggest that prices may break out to the upside, while downward sloping wedges suggest that prices may break out to the downside.

- Cup and Handle: This pattern is identified by a rounded bottom (the cup) followed by a small downward movement (the handle). It suggests that prices may be preparing for a bullish move higher.

These are just a few of the many chart patterns that traders use to analyze cryptocurrencies. It’s important to note that no pattern is foolproof and that traders should always use other technical analysis tools and consider market fundamentals before making trading decisions.

In conclusion, crypto chart patterns are essential tools for traders to analyze potential price movements in cryptocurrencies. They offer a visual representation of market trends and can help traders identify potential buying and selling opportunities. However, traders should always use other technical analysis tools and consider market fundamentals to make informed trading decisions.
Source
Check out more of our latest news here


Leave a comment