Bitcoin MACD- Will Bitcoin Hit $70,000 Soon?
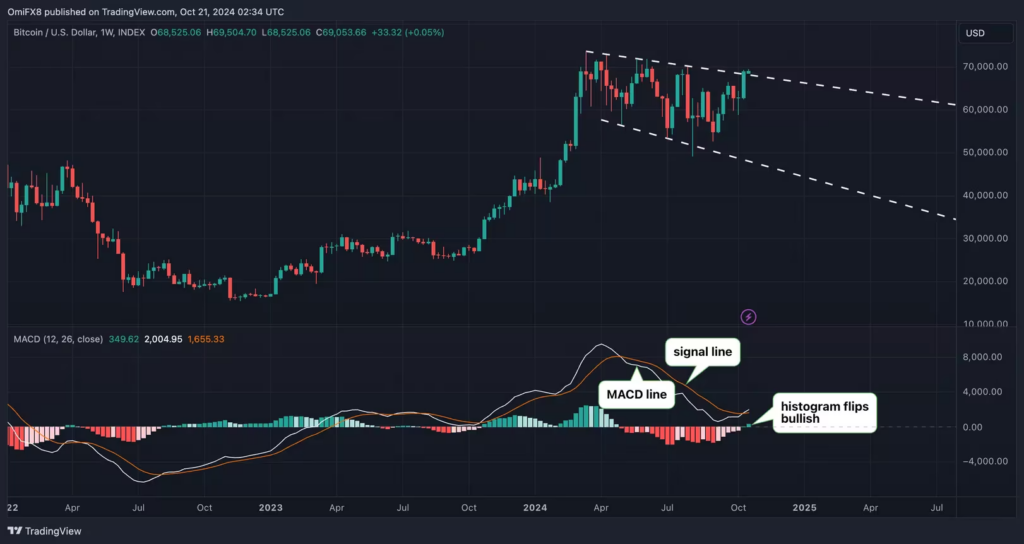
Bitcoin MACD– A recent indicator signaling seller exhaustion in early September has shifted bullish, strengthening the case for Bitcoin (BTC) to surpass $70,000. The moving average convergence divergence (MACD) histogram, an essential tool in technical analysis that helps measure trend strength and shifts, has turned positive on the weekly chart for the first time since April. According to TradingView, this suggests a renewed momentum in Bitcoin’s price trajectory, hinting at a bullish breakout after a lengthy period of consolidation between $50,000 and $70,000.
Factors Supporting Bitcoin’s Rise
This optimistic outlook aligns with a broader consensus regarding several market influences. Analysts point to the Federal Reserve’s shift towards a bias for rate cuts, the increasing likelihood of pro-crypto Republican candidate Donald Trump winning the U.S. election on November 5, and a weakening Japanese yen—all of which could propel Bitcoin towards the ambitious target of at least $100,000 by year-end.
The MACD is calculated by subtracting Bitcoin’s average price over the past 26 weeks from its average over the past 12 weeks. The signal line, a nine-week average of the MACD, allows traders to visualize momentum shifts through the histogram. The recent bullish MACD signal comes on the heels of a similar indication from the line break chart, reinforcing the notion that Bitcoin bulls are on the verge of breaking above the critical $70,000 resistance, a level they have struggled to maintain since the first quarter of this year.
Historical Context of MACD Signals

The last significant MACD bull cross occurred in October of the previous year, coinciding with Bitcoin’s breakout past the $30,000 resistance level. This movement culminated in a record high of over $73,000 in March of this year. The current MACD bull cross indicates a potential shift in market dynamics, similar to the signals seen during last year’s bear market bottom.
Bitcoin has already surged nearly 30% since dipping below $53,000 in early September, reaching as high as $69,500 during recent Asian trading sessions. The convergence of technical indicators and favorable macroeconomic conditions suggests that Bitcoin may soon establish a strong foothold above $70,000, paving the way for further gains as the year draws to a close.
FAQ
What is the MACD indicator and why is it important for Bitcoin?
The MACD (Moving Average Convergence Divergence) indicator is a technical analysis tool that helps traders identify trend strength and potential reversals. It calculates the difference between two moving averages of Bitcoin’s price, providing insights into momentum shifts. A bullish MACD signal suggests that the price may rise, making it a valuable tool for predicting upward trends in Bitcoin’s value.


Leave a comment