Market Analysis as of September 26: Bitcoin and Altcoins Experience Mixed Trends
Crypto News – Today, global markets are witnessing a resurgence of bearish activity, with the overall market capitalization settling 1.27% below its 24-hour peak, maintaining a total cap of $1.04 trillion at the time of reporting. The fear and greed index currently stands at 38, indicating prevailing market fear.
Bitcoin Price Analysis
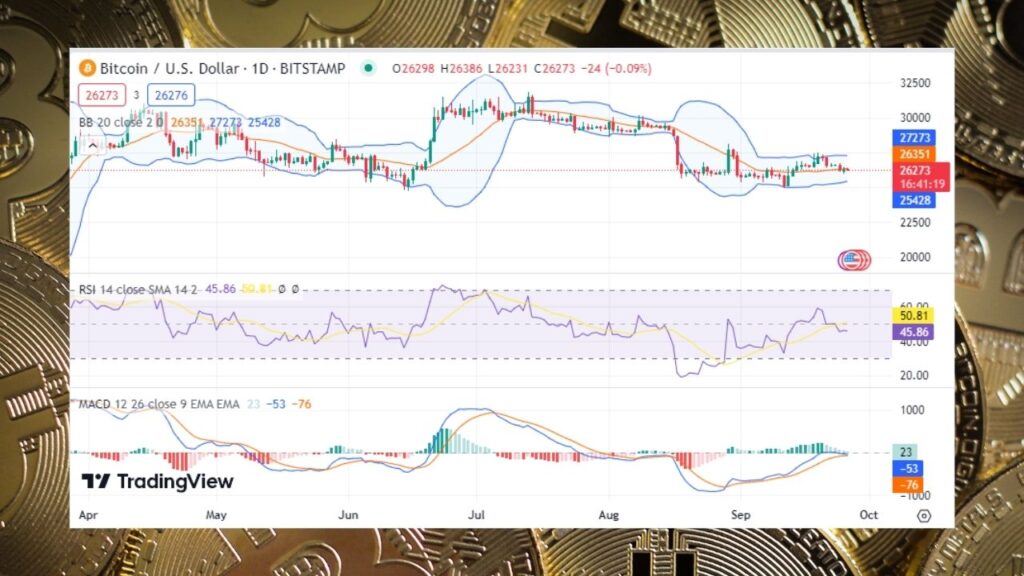
Bitcoin (BTC) has shown a slight bullish tendency, with the price resting at $26.27K at the time of reporting. This represents a daily increase of 0.52%, although there’s been a weekly drop of 2.1%. Concurrently, Bitcoin’s trade volume has decreased by 1.1% during the same period, now totaling $10.4 billion.
The Bollinger bands are exhibiting minimal movement, suggesting stable volatility levels for Bitcoin’s price. The Relative Strength Index (RSI) has dipped below the average line, indicating the influence of bears. Additionally, the Moving Average Convergence Divergence (MACD) is shifting from the green zone towards the red zone, indicating some bearish effects on Bitcoin’s price.
Ethereum Price Analysis
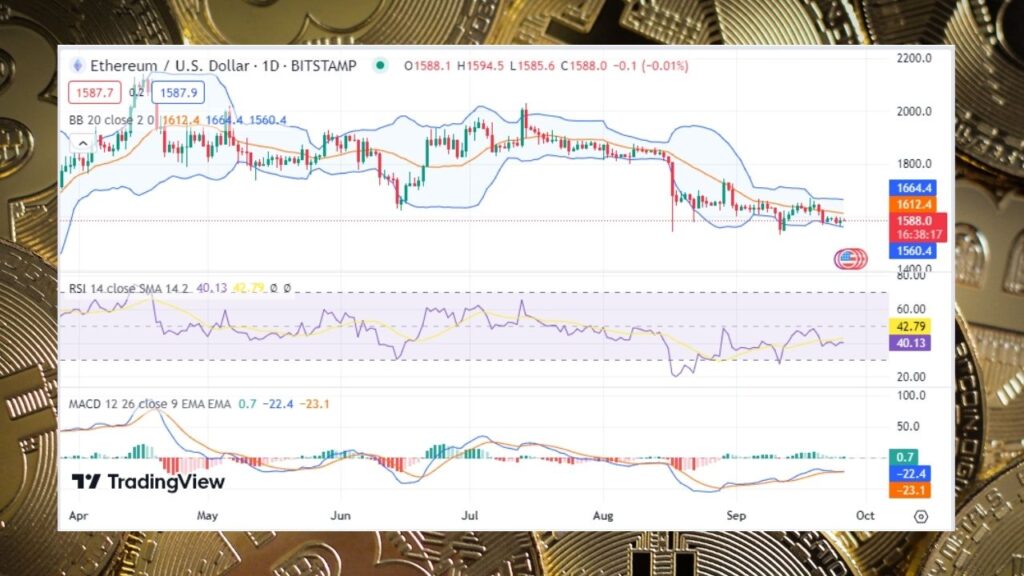
Ethereum (ETH) has experienced bullish activity, with its price standing at $1588 at the time of reporting. This reflects a daily increase of 0.6%, but a weekly decline of 3%. ETH’s trade volume has decreased by 7.4% during the week, now at $3.7 billion.
The Bollinger bands for Ethereum are showing slight divergence, signifying an uptick in volatility levels. The Relative Strength Index (RSI) is below the average line, suggesting an inclination towards a bearish market sentiment. However, the MACD is in the green zone, indicating some bullish efforts on Ethereum’s price.
Bitcoin Cash Price Analysis
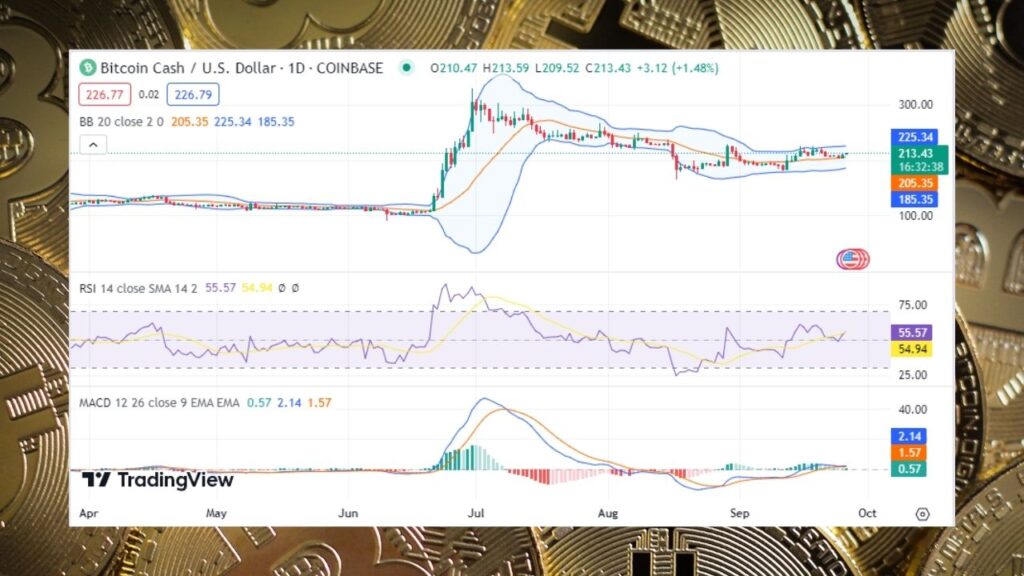
Bitcoin Cash (BCH) is riding a bullish wave, with its price at $212.98, showcasing a daily increase of 3.4%. Over the week, there has been a modest drop of 1.8%. BCH’s trade volume has surged by 30.6% in this period, reaching $148 million.
The Bollinger bands for Bitcoin Cash are converging, indicating relatively low volatility levels in its price. The Relative Strength Index (RSI) is above the average line, highlighting the dominance of bulls in Bitcoin Cash’s price trend. The MACD is also in the green zone, reinforcing the bullish sentiment.
Avalanche Price Analysis
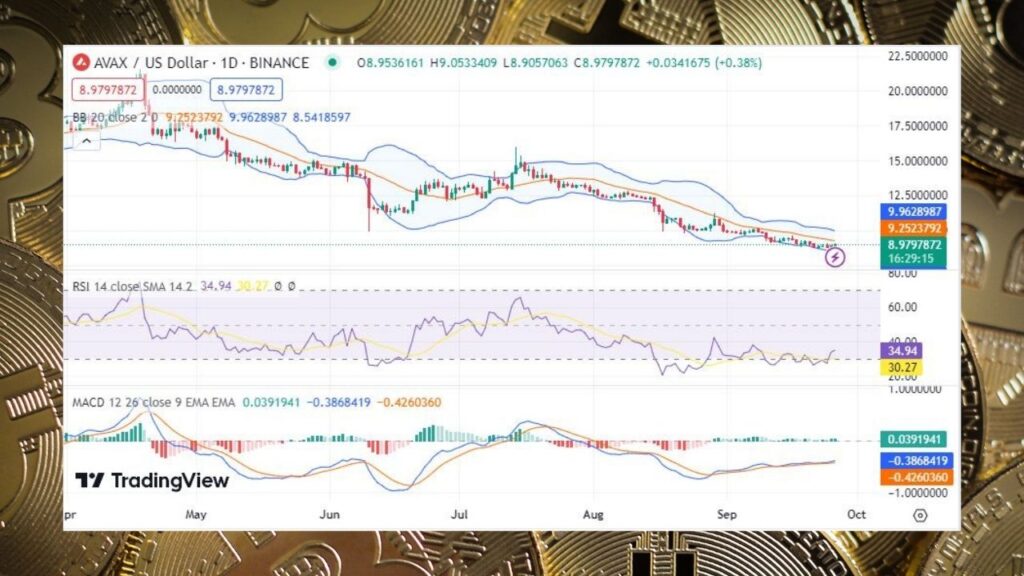
Avalanche (AVAX) is also experiencing bullish momentum, with its price at $8.98, representing a daily increase of 1.59%. Over the week, there’s a 2% decline in price. AVAX’s trade volume has risen by 3.49% during this period, now standing at $98.2 million.
The Bollinger bands for Avalanche are converging, indicating a decrease in volatility levels. The Relative Strength Index (RSI) is above the average line, pointing to a dominant bullish sentiment for Avalanche prices. Additionally, the MACD is in the green zone, further corroborating the bullish outlook.
Uniswap Price Analysis
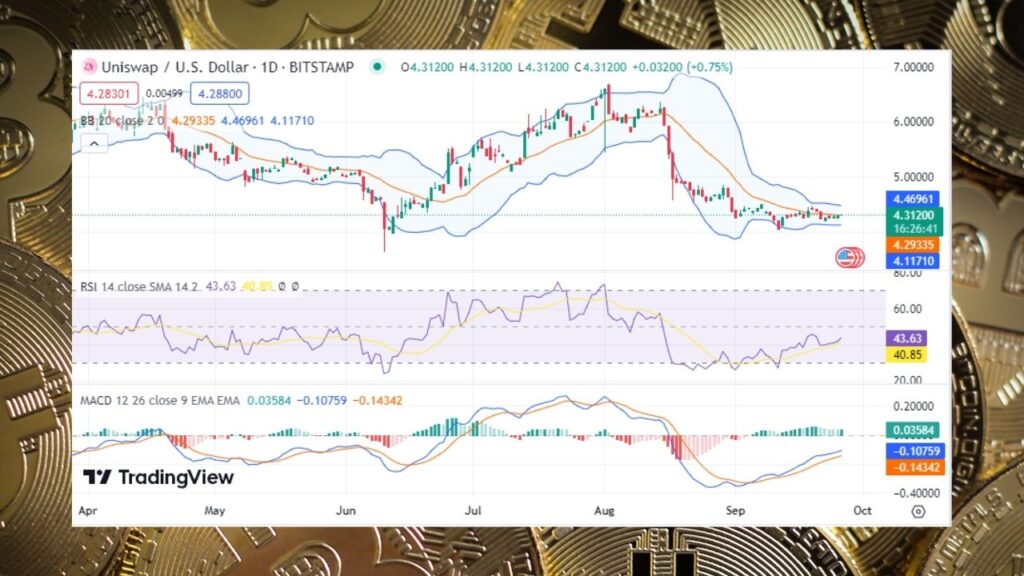
Uniswap (UNI) is also experiencing a bullish upturn, with its price at $4.29, showcasing a daily increase of 0.99%. Over the week, there’s a 2.4% drop in price. UNI’s trade volume has increased by 2.5% during this period, totaling $44.13 million.
The Bollinger bands for Uniswap are converging, indicating a decline in volatility levels. The Relative Strength Index (RSI) is above the average line, illustrating the dominance of bulls in Uniswap’s price trend. Furthermore, the MACD is also in the green zone, supporting the prevailing bullish sentiment.


Leave a comment