Ethereum Retests Key Levels: Is a Massive Rally Brewing?

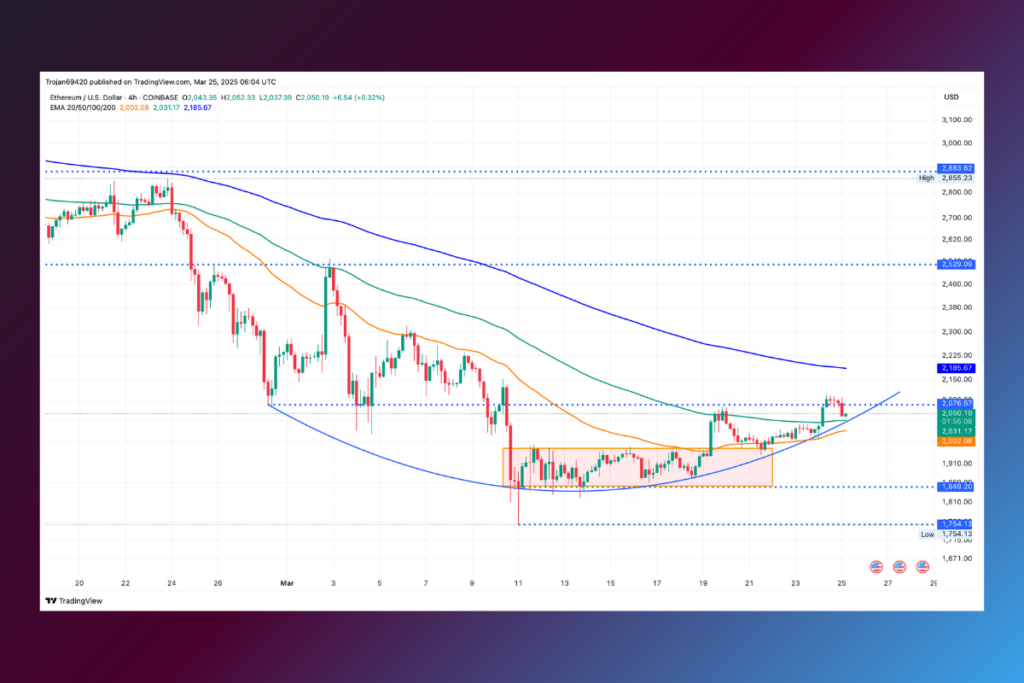
Ethereum continues to dominate above the $2,000 threshold despite the growing expectation that the cryptocurrency market will regain its $3 trillion valuation. With a 1.28% intraday drop, Ethereum is currently trading at $2,954 after recently retesting the psychological $2,000 mark. On the 4-hour chart, however, a brief recovery and a lower price rejection point to a possible resurgence. Whether this post-test reversal will assist Ethereum in hitting the $2,500 mark is yet unknown.
Ethereum ETF Flows Stall, but Price Action Hints at a Bullish Comeback

With a breach from a consolidation zone, Ethereum’s price trend displays a reversal rally on the 4-hour price chart. Near the $2,100 level, Ethereum saw an uptrend and crossed above the 100 EMA line. However, a higher price rejection has caused the 100 EMA line to retest close to the crucial $2,000 threshold. The general trend is still optimistic, with the uptrend continuing to gain strength despite this slight setback.
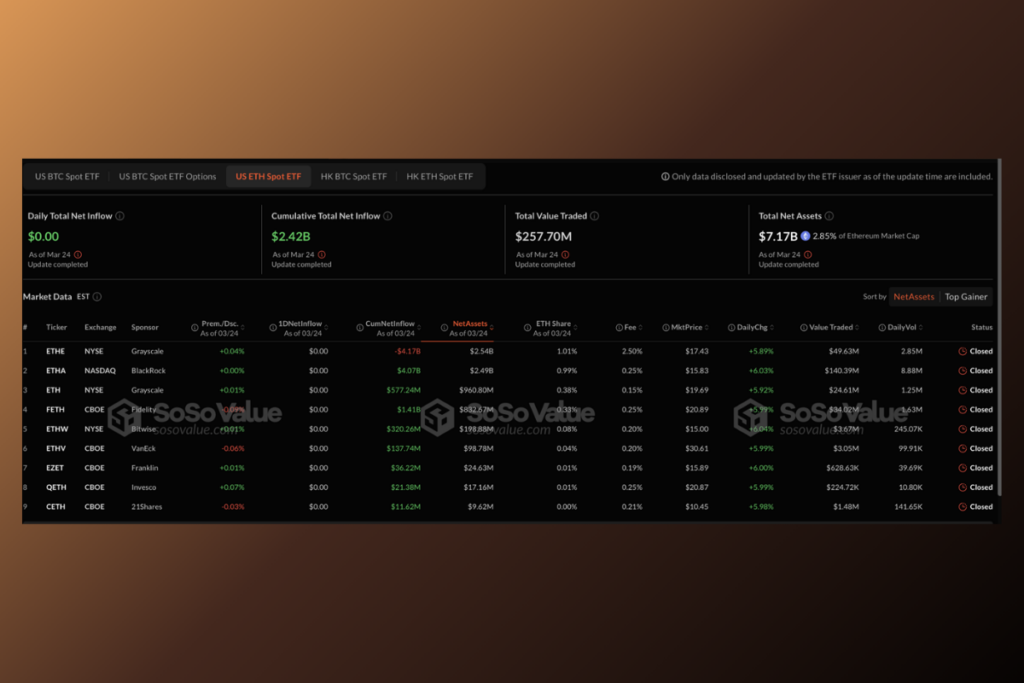
According to institutional investment in Ethereum, there was a net-zero flow on March 24, as the price pattern suggests a possible recovery. Since Ethereum ETFs first appeared on the US market, this is the seventh day with net-zero flow. At the moment, Ethereum ETFs own $7.17 billion in net assets, or 2.85% of the market capitalization of Ethereum.
Will the Bullish Pattern Lead to a Massive Surge?
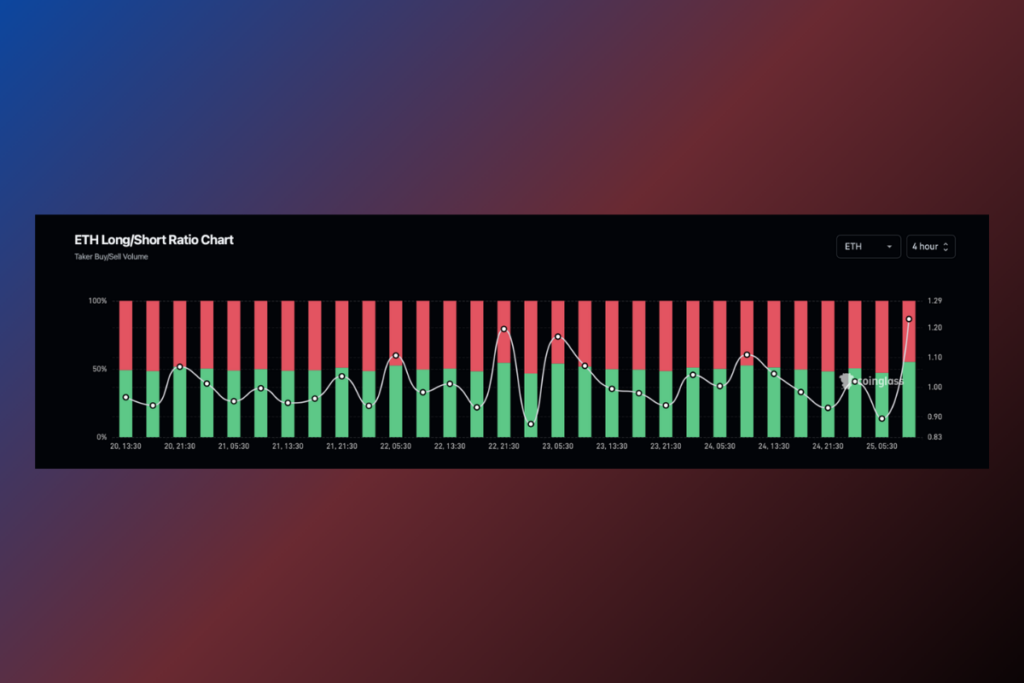
The market for Ethereum derivatives is becoming more optimistic due to the short-term recovery and increasing chances of a bull run. Over the last four hours, long positions have increased to 55% of all contracts, according to the Ethereum long/short ratio chart. With a notable rise in bullish positions, the long-to-short ratio now stands at 1.2287.

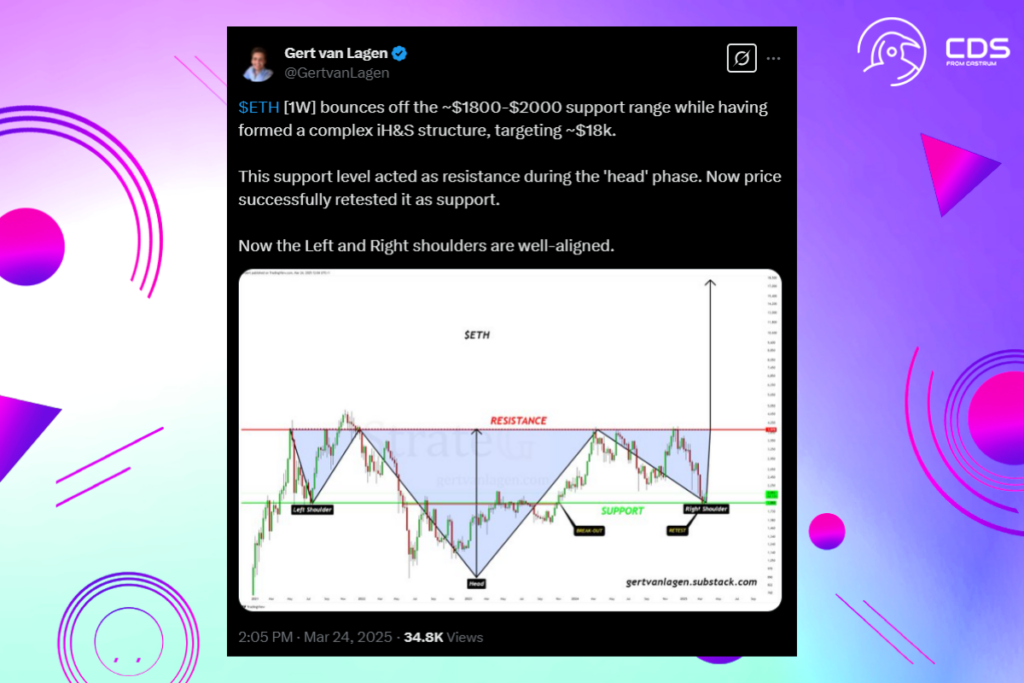
Crypto expert Gert van Lagen has pointed out that Ethereum may form an inverted head-and-shoulders pattern on the weekly chart as it begins to recover. The analyst believes that Ethereum is nearing the completion of the bullish pattern as the price trend bounces off the $1,800–$2,000 support level. With the neckline placed close to the $4,000 psychological mark, the short-term recovery might signal the beginning of the pattern’s right shoulder.

For more up-to-date crypto news, you can follow Crypto Data Space.


Leave a comment