Solana Price Stability in Question: Will Support Hold or Is a Drop Coming?

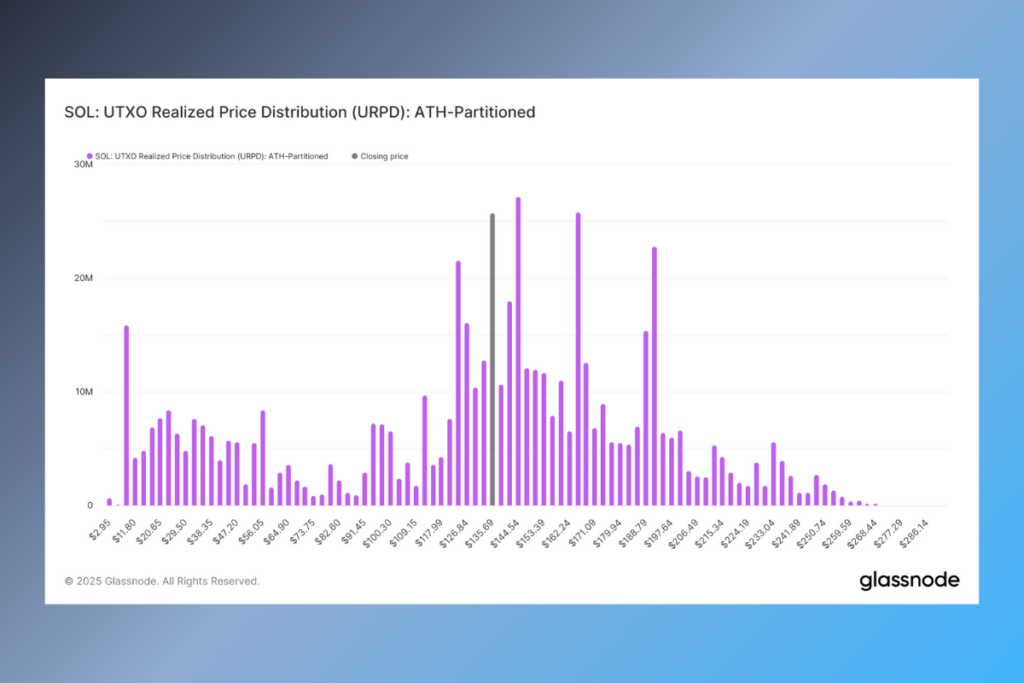
As the asset moves through pivotal price points, Solana (SOL) traders and investors keep a close eye on the most recent on-chain data. UTXO Realized Price Distribution (URPD) used by AMB Crypto in its analysis reveals notable supply concentrations at different price points, providing information about possible support and resistance zones. Predicting SOL’s future move can be aided by knowing these crucial levels as it tries to stabilize.
SOL Investors Strengthen Positions: Is a Bullish Breakout Coming?
At about $112.10, one of the main Solana accumulation zones, 9.7 million SOL, or 1.67% of the entire supply, is concentrated. There were roughly 4 million SOL at this level as of January 19th, suggesting that long-term investors have been strengthening their holdings. These accumulation zones have historically served as strong support since investors may want to guard their entry prices and prevent additional falls.
Other support levels are found at approximately $94, $97, and $100, which together make for 3.5% of the circulating supply or almost 21 million SOL. They might be crucial price floors if SOL is under downward pressure.
Solana Bulls Face Major Hurdles! Can They Overcome Resistance?

In the past, these levels were important areas for accumulation, and many investors could try to sell at break-even. The development of great resistance may result from this. The URPD data also shows recent accumulation at $123 and $126, which correspond to holdings of 16.2 million SOL (2.7% of the supply) and 19 million SOL (3.2% of the supply), respectively. Because of this, these levels might provide temporary stability and serve as resistance points, especially if the upward trend slows down.
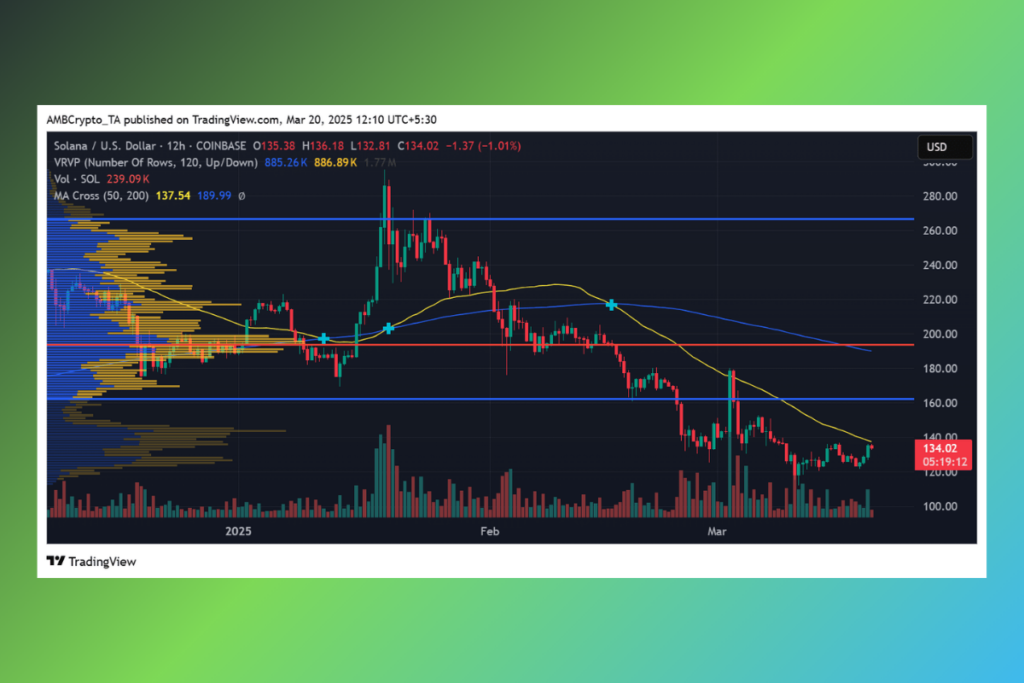
At these critical supply zones, Solana’s current price behavior points to a conflict between bulls and bears. SOL might try to break through resistance around $135–$144 if purchasing interest remains around the designated support levels. However, if $94 is not maintained, the asset may be more vulnerable to a decline. To predict the asset’s next big move, traders should keep a close eye on volume patterns and liquidity zones.
For more up-to-date crypto news, you can follow Crypto Data Space.


Leave a comment