1 February Ether Price Analysis: Wedge Breakout Could Trigger a Rally

The price of Ethereum (ETH) is consolidating within corrective patterns that may eventually result in breakouts, and it is currently at critical technical levels. A possible bullish turnaround is suggested by the descending wedge that ETH is building.
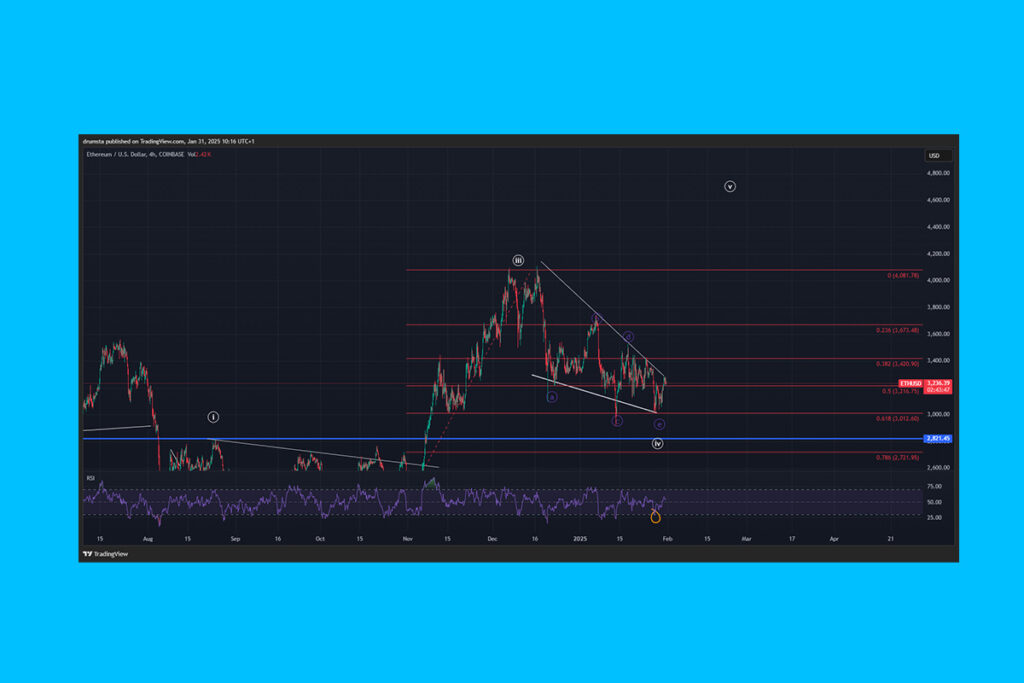
A descending wedge formation on Ethereum’s 4-hour chart indicates that a possible breakout may be on the horizon. Following the completion of Wave (iii) of a five-wave impulse and an ABCDE corrective pattern, the asset has been consolidating within this structure. A bullish turnaround is very likely if ETH can maintain momentum above significant resistance levels. The price is still trapped between the Fibonacci retracement levels of 0.5 and 0.382, nevertheless, suggesting a crucial turning point for its future course.
A minor bullish divergence at recent lows is seen by the 4-hour Relative Strength Index (RSI), which suggests that purchasing pressure is getting stronger. But ETH hasn’t put up a strong showing over the $3,420 resistance level (0.382 Fib). A more complete retracement in the direction of lower Fibonacci support zones may result from sellers holding control until that time.
ETH Price Forecast: Elliott Wave Analysis Signals Rally Toward $4,600

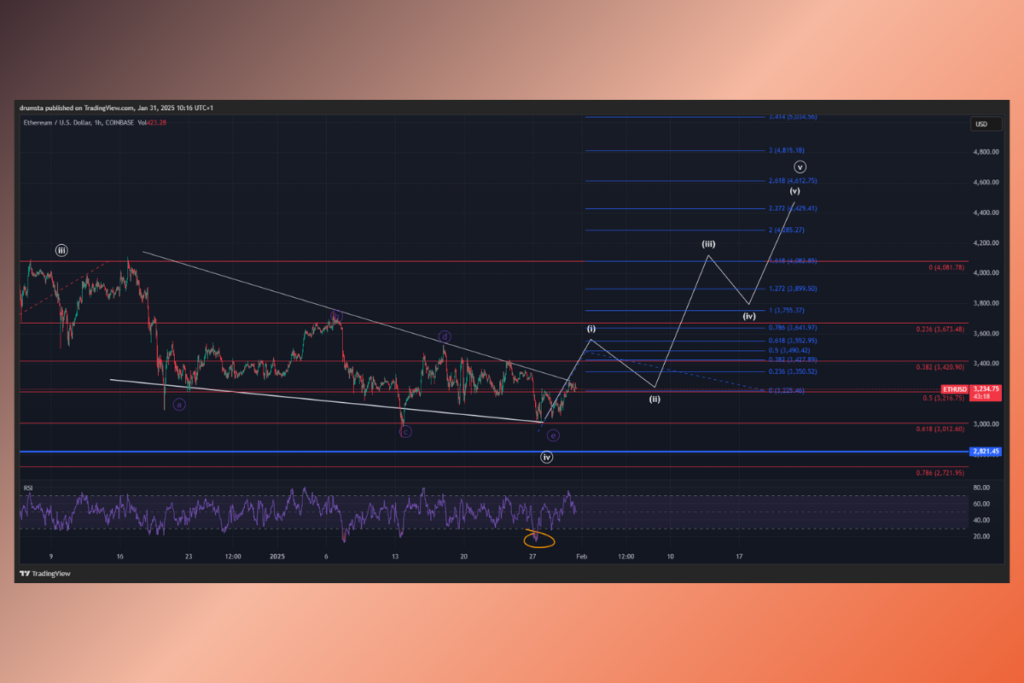
Ethereum is aiming to confirm the bullish reversal and break out of a descending wedge structure. A thorough Elliott Wave count is displayed on the chart, signifying the end of wave (iv) and the start of a five-wave upward impulse. The present price is close to $3,411, which is a crucial pivot point.
Before wave (iii) pushes ETH toward its next significant resistance zones, wave (i) has probably started, and a corrective wave (ii) pullback might take place. With wave (v) possibly pushing beyond $4,600, Fibonacci extensions predict a price target above $4,000 if bullish momentum persists.
For more up-to-date crypto news, you can follow Crypto Data Space.


Leave a comment