Solana Bears Dominate: Bearish Pattern Suggests Further Downside Risk

Many coins are plummeting as a result of the cryptocurrency market’s increasing liquidations. Over the last seven days, Solana has seen a sharp decline of 11.90 percent. With a huge intraday bearish engulfing candle, SOL’s trading price is currently at $187.53. So, will Solana plummet below $150 if the cryptocurrency market’s liquidations reach $528 million and Bitcoin falls below the $92K threshold?
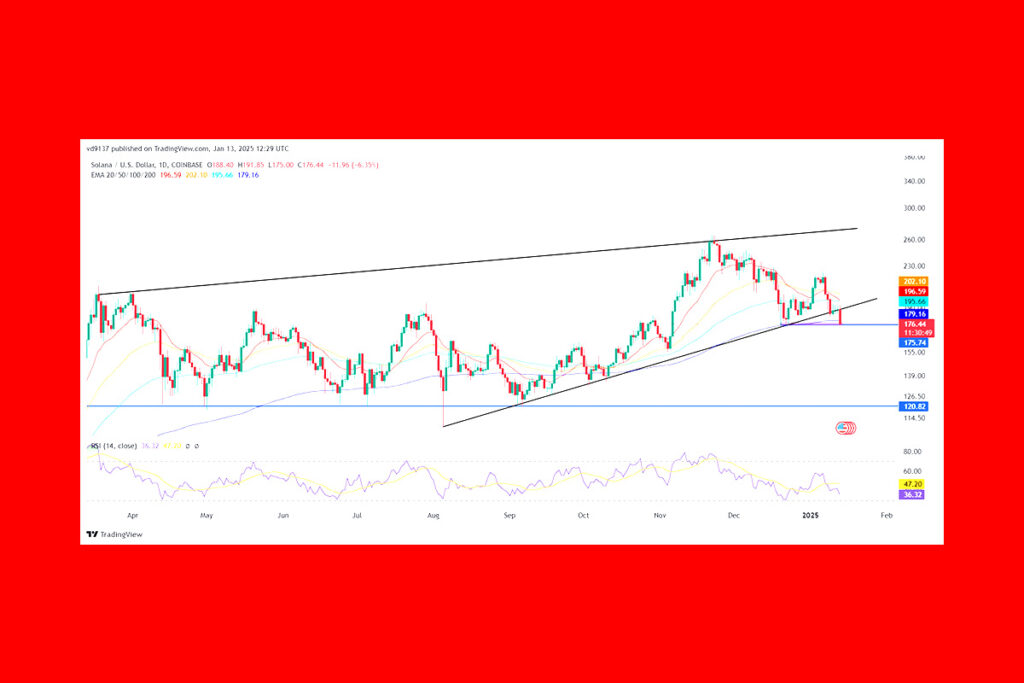
A bearish collapse of a long-coming support trend line can be seen in the Solana price trend on the daily chart. With the intraday bearish engulfing candle of a 6.35% decline, this concludes a rising wedge pattern negatively. At $175, it is currently in the test-crucial support zone. Additionally, the 200 EMA line has been breached by the bearish engulfing candle. The crossover between the 20-day and 50-day EMA lines has been impacted by the current correction. As a result, Solana is receiving a sell signal from the average moving lines.
SOL Price Faces Crossroads: $175 Support or $155 Retest?

In contrast, the recent retest of the $175 support zone shows a bullish divergence on the daily RSI line. This suggests that there may be a retest of the broken trend line. The bulls may so regain the trend momentum if the Solana price maintains a daily closing above the 200 EMA line and the support zone. Perhaps the $200 breakout will be retested. The $155 support level will probably be retested in the event of a bearish closing.
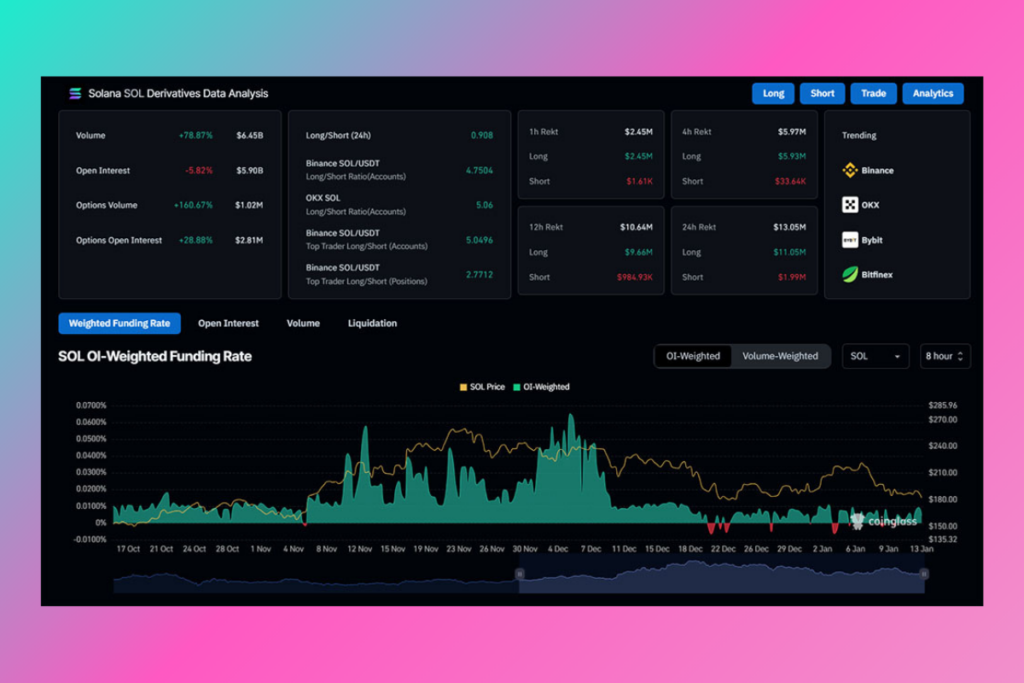
On the other hand, as the bearish sentiment in the cryptocurrency market grows, Solana’s derivatives suggest a further correction. The open interest has fallen below $6 billion. It saw a decline of 6.07% today, closing at $5.90 billion. An extremely pessimistic stance in the cryptocurrency market is shown by the long-to-short ratio, which has fallen to 0.8854.
For more up-to-date crypto news, you can follow Crypto Data Space.


Leave a comment