Solana Market Update: Consolidation May Precede Bullish Breakout

After settling for the last three weeks, Solana’s price has remained stable. SOL stabilizing above a critical support level is likely to alter this scenario. As Bitcoin rises above $100,000, altcoins are also expected to rise. SOL is positioned for future growth, according to one analyst. How high the Solana could climb to set up its next ATH is confirmed by the expert.
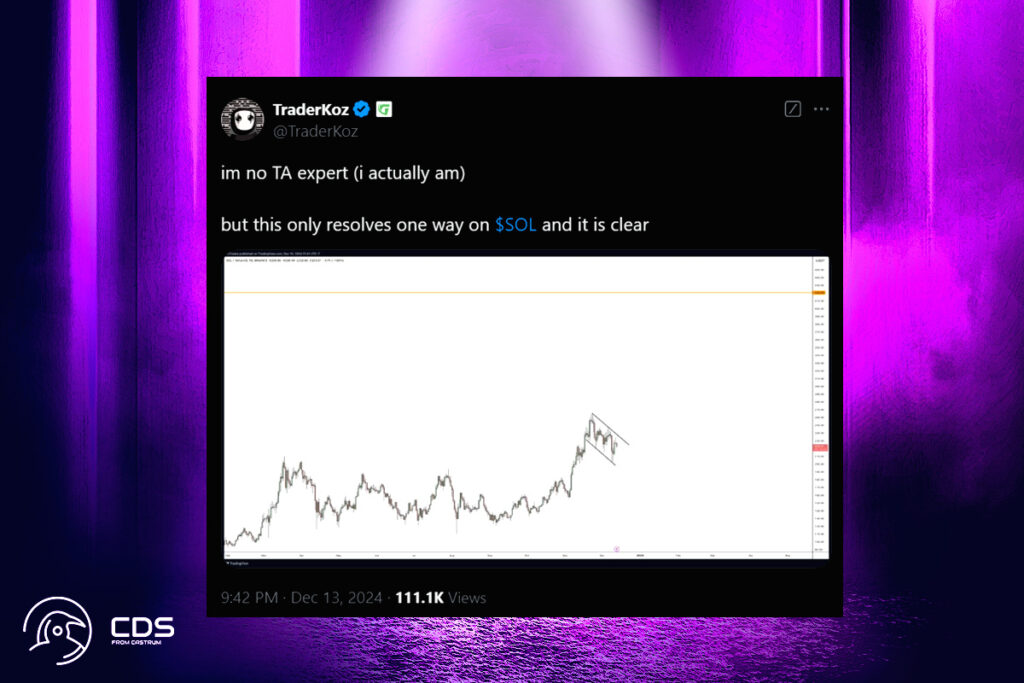
Recently, a cryptocurrency analyst made a perceptive prediction about the future of Solana’s price. According to technical analysis, the analyst predicts that the market may rise to new all-time highs (ATH). A bullish continuation pattern may be indicated by the present price movement, which shows consolidation within a descending channel.
SOL’s Path to $420: Key Resistance Levels and Bullish Indicators
Over the past few months, the price of Solana has recovered from its previous lows and seen tremendous rises. The expert points to the next important resistance zone around $420.68, where the price is now trading at about $219. Since it is Solana’s prior all-time high, this level is still quite important. SOL is establishing higher lows, according to the chart analysis, which is a strong bullish indication for additional upward momentum. A strong rally toward the target price can result from breaking out of the present channel.
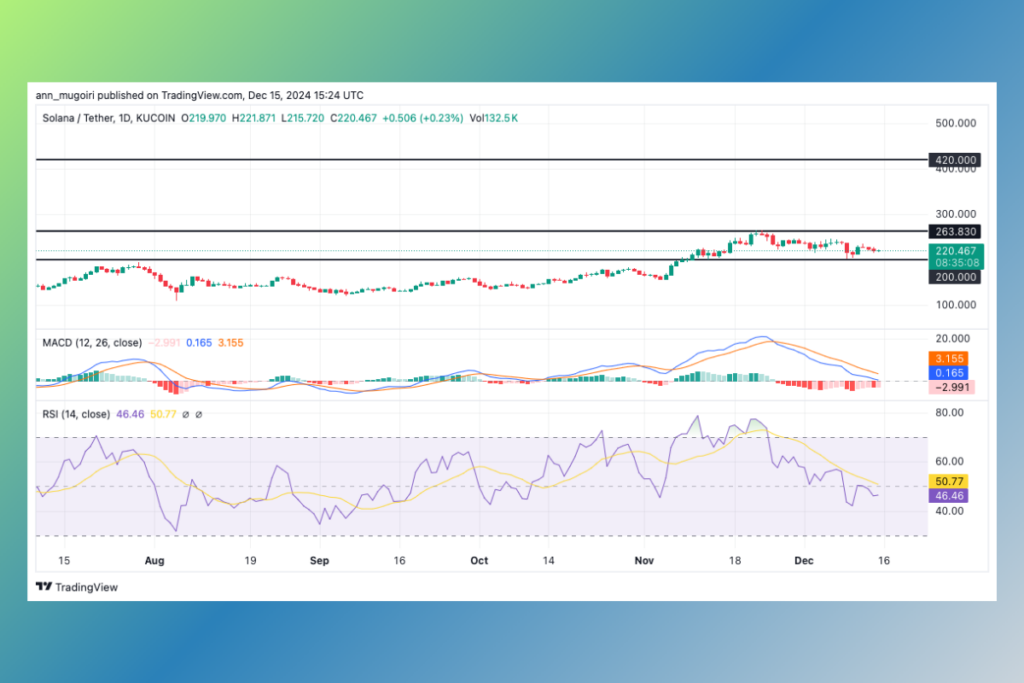
The price of SOL has somewhat decreased as of this writing, standing at $219.83. In the past 24 hours, this is a 0.35% increase. The price of the cryptocurrency fluctuated between a low of $216.38 and a high of $227.04. It is still lower than its peak of $263.83, which was reached on November 23, 2024. Regaining control of the positive pressure might lead to the SOL price prediction reaching $263, which would be close to its previous all-time high (ATH). Should buyers continue to gain ground, Solana’s price might rise to $300 and possibly challenge the $420 barrier level.
SOL Faces Bearish Pressure: MACD Trends Lower, RSI Stays Neutral

Given that the MACD line is presently trending below the signal line, the Moving Average Convergence Divergence (MACD) indicator indicates a bearish outlook. Additionally, the histogram displays diminishing green bars, indicating a decrease in bullish strength. With a value of 46.44 on the Relative Strength Index (RSI), SOL stays in the neutral range. This level indicates a lack of quick bullish momentum but also points to a balance between buyers and sellers.
For more up-to-date crypto news, you can follow Crypto Data Space.


Leave a comment