Chainlink Price Shows Resilience Amid Market Rally, But Broader Bearish Trends Persist
Over the past 24 hours, Chainlink has demonstrated some strength as the overall cryptocurrency market experienced a rise. The asset’s price increased by 3.6%, reaching $10.50. However, technical analysis indicates that Chainlink remains trapped within a broader bearish pattern, raising the question of whether the prevailing bullish market sentiment will be enough to shift its trajectory.
Can Traders Sustain the Chainlink Price Rally?
There is a concerning disparity between Chainlink’s price movements and its on-chain metrics. While an in-depth analysis of LINK’s open interest (OI) and price relationship suggests bullish sentiment among traders, on-chain data tells a different, more bearish story.
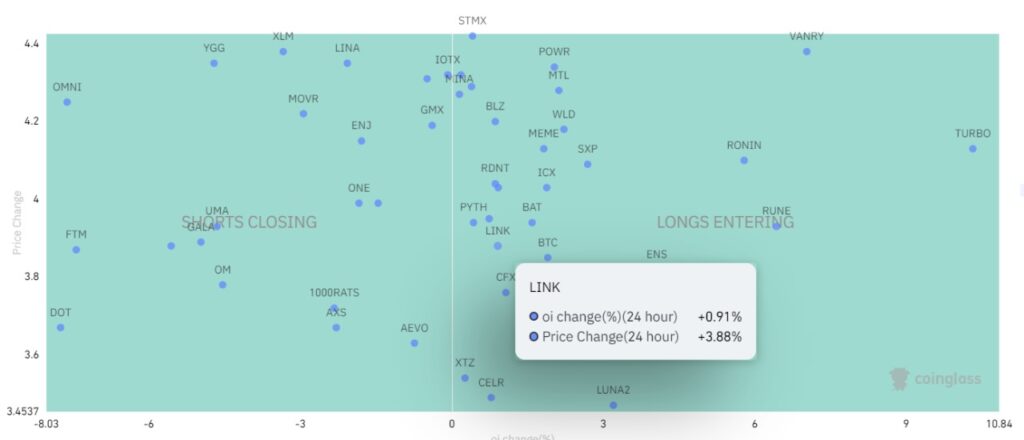
According to the Coinglass Crypto Derivatives Visualizer, LINK’s OI rose by 0.91% over the last 24 hours, coinciding with a 3.88% price increase during the same period. When both price and OI rise together, it typically signals that traders are entering long positions, which is a bullish indicator for the asset’s price.

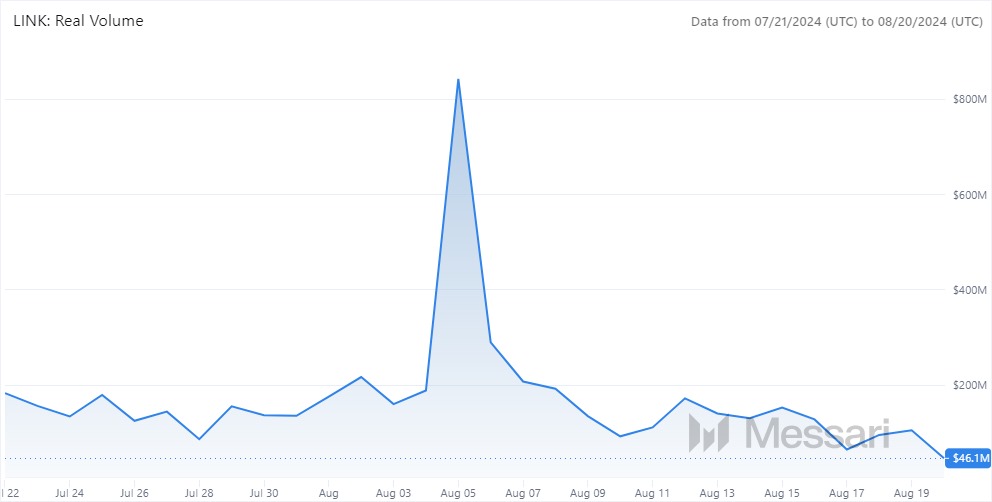
However, Chainlink’s on-chain activity paints a less optimistic picture. Data from Messari Research shows that LINK’s real on-chain volume has dropped to a monthly low of $46.1 million, with only a few anomalies, such as a spike on August 5, when the entire crypto market experienced a crash.

This trend suggests that while futures and spot traders are helping to prop up the price, there is little activity occurring on-chain in terms of transactional volume. Although this could be interpreted as Chainlink focusing on institutional clients, the consistent decline in on-chain volume remains a point of concern.
Chainlink Price Analysis: Is a 47% Drop Inevitable?
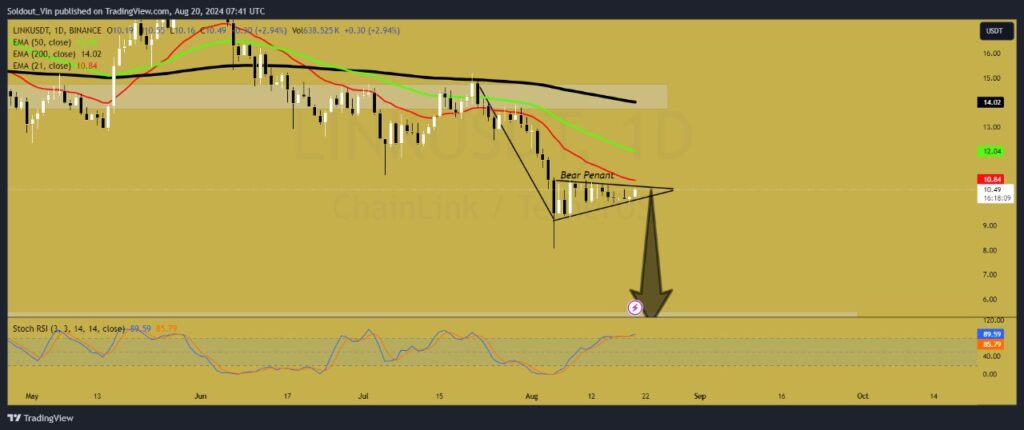
Chainlink’s price forecast suggests that the asset is currently in a bearish continuation pattern, specifically a Bear Pennant. This pattern indicates that LINK may continue its downward trend following a period of consolidation.
Should the price follow through with the Bear Pennant pattern, LINK is likely to find support around the $10.49 level. However, a break below this support could push the price toward the next major support at approximately $9.00. Beyond that, a long-term support target could be set around $5.50, based on the projected downward height of the flagpole—a potential 47% drop from the current price.
All exponential moving averages (EMAs) are sloping downward and expanding, which confirms the bearish outlook. Additionally, Chainlink is trading below all these averages, reinforcing the downtrend.
The Stochastic RSI is currently in the overbought zone, suggesting that the asset may be poised for a short-term pullback or a continuation of its downtrend. The %K (RSI line) and %D (Signal line) are converging, indicating a potential bearish crossover.

If LINK manages to break above the $10.85 level, this could invalidate the Bear Pennant and the bearish outlook. In that scenario, LINK would likely test the next significant resistance levels at $12.04 and potentially $14.50.


Leave a comment