Bitcoin Faces Resistance While TOTALCAP Struggles; BONK Hits New All-Time High
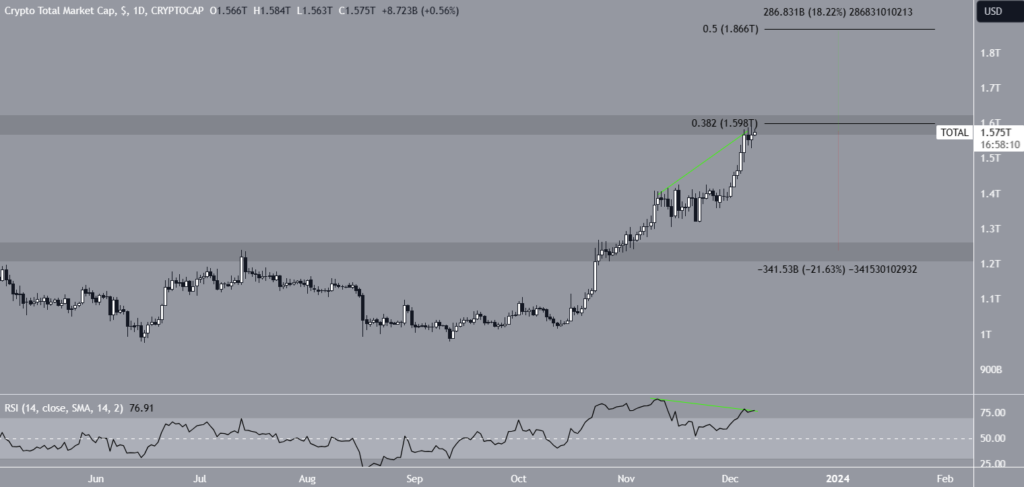
Crypto News – The TOTALCAP has been on a swift ascent since late October, breaking through the horizontal resistance zone at $1.25 trillion. This upward trajectory culminated in a new annual high of $1.59 trillion as of yesterday.
TOTALCAP is currently navigating a challenging confluence of resistance levels at the $1.60 trillion mark. This resistance is formed by the 0.382 Fibonacci retracement level and a horizontal resistance area.
Traders in the market often rely on the Relative Strength Index (RSI) as a momentum indicator to gauge overbought or oversold conditions and make informed decisions regarding asset accumulation or divestment.
RSI readings above 50, coupled with an upward trend, suggest that bulls maintain an advantage, while readings below 50 imply the opposite.
Despite being in overbought territory, the daily RSI remains above 50 and continues to climb. However, it’s worth noting that the indicator has exhibited a bearish divergence (indicated by the green line), potentially indicating a waning momentum in the rally.

In the event that TOTALCAP manages to break through this resistance, there is potential for an 18% increase, with the next target being the 0.5 Fibonacci retracement resistance at $1.87 trillion.
However, it’s important to exercise caution, as a rejection at the $1.60 trillion resistance level could result in a substantial 22% drop, potentially revisiting the $1.25 trillion support level.
Can Bitcoin Maintain Its Position Above Resistance?
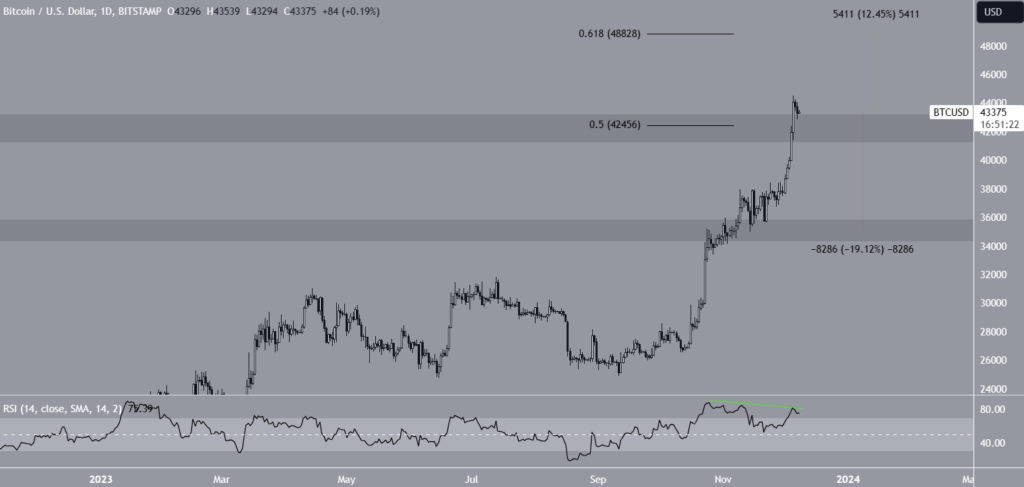
BTC‘s price has seen an upward trajectory since breaking free from the $35,000 horizontal resistance area in November, reaching a new yearly high of $44,500 on December 5.
This high was achieved above the 0.5 Fibonacci retracement resistance level at $42,450, and BTC‘s price has maintained a daily close above this crucial level.

Much like TOTALCAP, the daily RSI has exhibited a bearish divergence, signaling a potential slowdown in the rally’s momentum.
Should the Bitcoin price successfully validate the $42,450 level as support, there is a possibility of a 12% increase, targeting the subsequent resistance level at $48,800, marked by the 0.618 Fibonacci retracement resistance.
Despite this optimistic BTC price projection, a daily close below the $42,450 area could lead to a significant 20% decline, revisiting the closest support level at $35,000.
BONK Attains New All-Time Highs
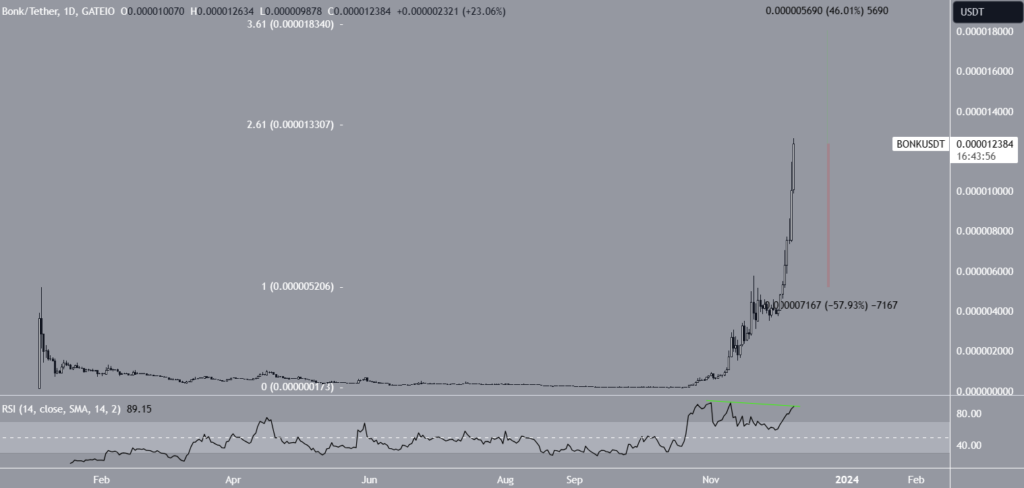
Over the past seven days, BONK‘s price has surged significantly, consistently forming bullish candlestick patterns. Today, BONK reached a remarkable new all-time high of $0.000012, closely aligning with the 2.61 external Fibonacci retracement from the previous decline.

In a manner reminiscent of Bitcoin and TOTALCAP, the daily RSI has also displayed a bearish divergence.
The future trajectory of BONK’s price hinges on whether it breaks above the 2.61 external Fibonacci retracement or faces rejection.
A successful breakout could potentially propel BONK to a 45% increase, targeting the next resistance level at $0.000018. Conversely, a rejection might lead to a substantial 60% drop, revisiting the nearest support level at $0.000005.


1 Comment