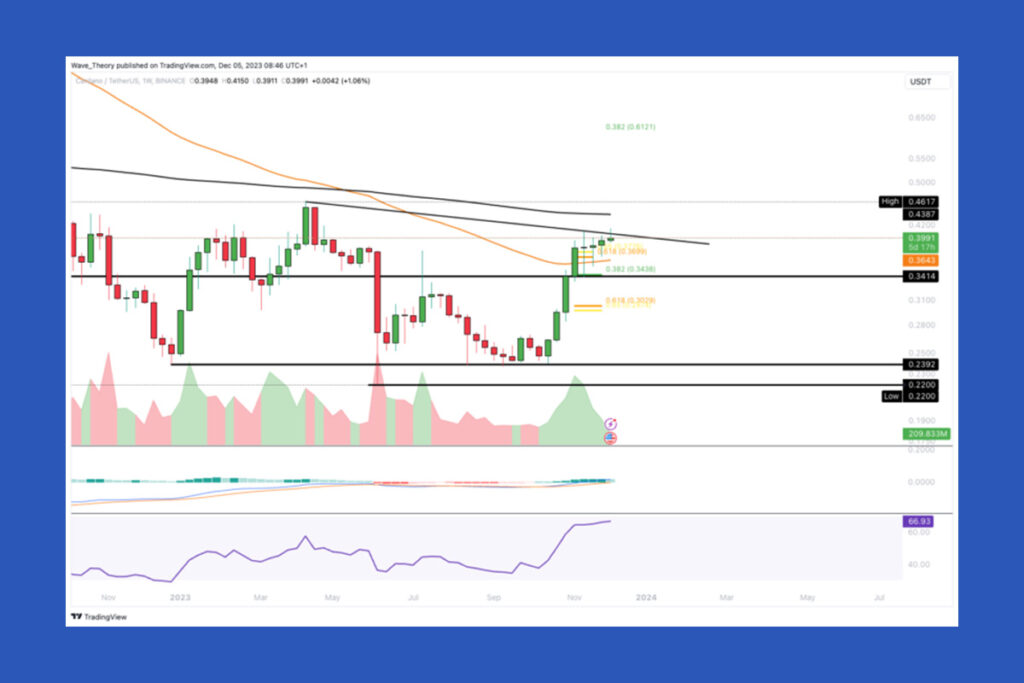
Crypto News – Cardano (ADA) appears to be at a critical juncture based on its current market placement. The cryptocurrency finished its corrective phase, and now it is up against a critical resistance trend line.
Can the Cardano ADA Price Rise Again?
Last month, Cardano made an unsuccessful attempt to break over this trend line resistance. To find out if it can accomplish a bullish breakout this time, it’s critical to keep an eye on the market’s current activity. Should ADA succeed in breaking past this barrier, the market’s trajectory will likely change significantly, and a novel bullish trend would be suggested.
It appears that Cardano’s price will continue to rise this month based on its present pattern. Not too dissimilar from last month’s bearish rejection, Cardano is currently running into resistance at a notable trend line. Linking the end of 2022 top with the current November monthly high creates this trend line.
Cardano Needs to Break the Golden Ratio Resistance Level
Beyond the current level, at approximately $0.43, there is another significant barrier that adds to this resistance at the 50-month EMA (Exponential Moving Average). It would be advantageous for Cardano to break through this resistance zone, especially the $0.4–$0.43 range. The targeted price is around $0.61, which is the.382 Fibonacci resistance level.
For a full bullish trend reversal, Cardano has to break through the golden ratio resistance level, which is located at $0.86. This perspective is further supported by the Moving Average Convergence Divergence (MACD) histogram, which has been exhibiting a positive trend for several months. The MACD lines have now crossed in a bullish manner.
Death Cross Seen on the Exponential Moving Average Chart

A death cross is visible in the weekly chart of the Exponential Moving Averages (EMAs). A short-term moving average crossing below a long-term moving average results in this pattern. In the intermediate term, this is frequently seen as a bearish indication. Consequently, the existence of a death cross implies that, notwithstanding recent uptrends, Cardano’s medium-term trend may still be strongly bearish.
Concerning Cardano’s market behavior, these conflicting indicators—the bearish death cross in the EMAs, the neutral RSI, the bullish MACD lines, and the current price rebound—paint a complicated picture. A time of uncertainty and perhaps volatility is indicated by this. To avoid confusion in the medium run, traders and investors should approach the market with caution and keep a close eye on these technical indicators.


Leave a comment