


Featured News Headlines
ETH Stuck in Narrow Range Amid Low Volatility Signals
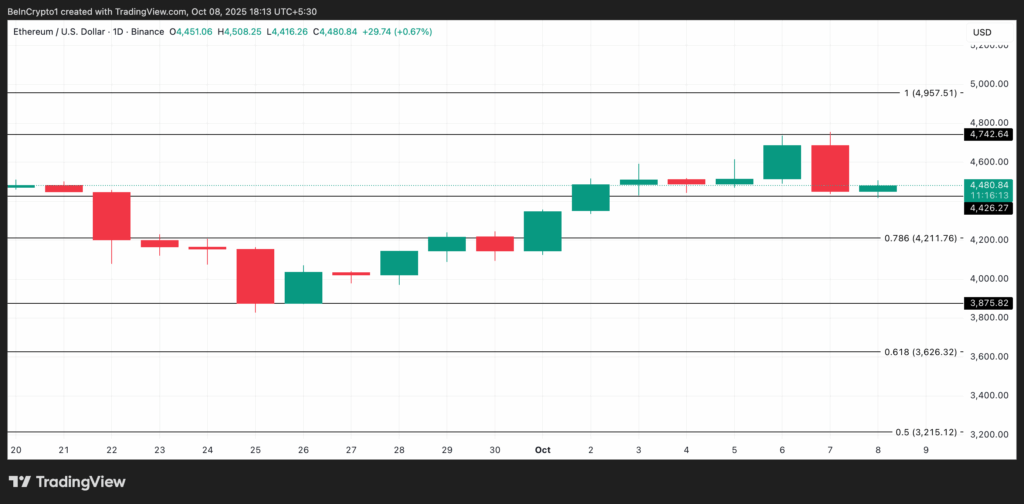
Ethereum (ETH) has been trading within a tight price band over the last three sessions, indicating a period of market indecision. Since Monday, the altcoin has encountered resistance near $4,742 and found support close to $4,426. This sideways price movement reflects a broader market environment marked by diminished volatility and balanced buying and selling activity.
The latest readings from the ETH/USD one-day chart underscore this consolidation phase, where neither bulls nor bears have gained clear dominance. Such price behavior often signals cautious sentiment among traders, who appear reluctant to commit strongly in either direction until clearer market signals emerge.
Declining Volatility Signals Caution
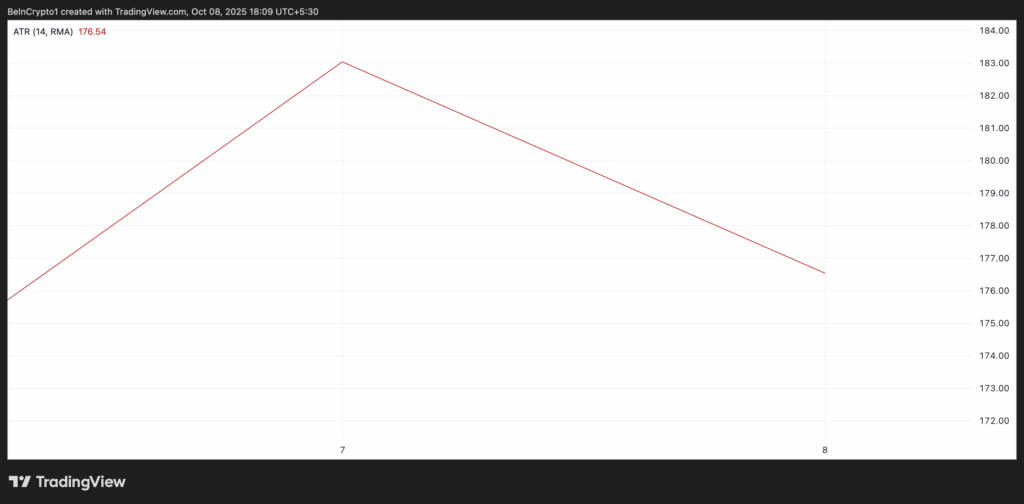
A key metric highlighting this trend is Ethereum’s Average True Range (ATR), which measures price volatility over a defined period. Currently, the ATR stands at 176.54, showing a decline compared to previous sessions. A falling ATR suggests that price fluctuations have narrowed, and market participants are adopting a more risk-averse stance.
Lower volatility typically leads to reduced trading volumes and smaller price swings, which in Ethereum’s case, means the price remains confined within the established support and resistance levels. This subdued environment is also reflected in other technical indicators.


RSI Reflects Balance Between Buyers and Sellers
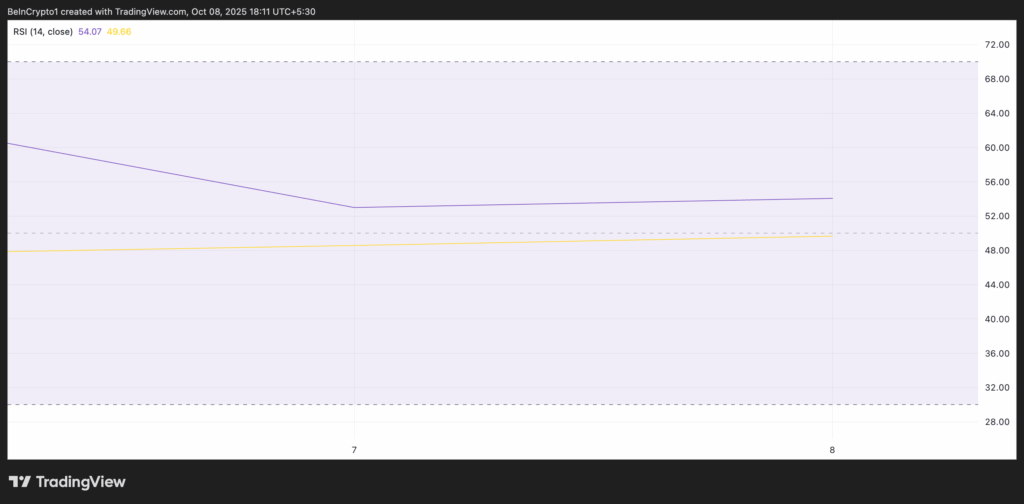
Ethereum’s Relative Strength Index (RSI) has flattened out at 54.07, reinforcing the notion of equilibrium in the market. The RSI gauges whether an asset is overbought or oversold on a scale from 0 to 100. Values above 70 indicate potential overbought conditions, which could foreshadow a price correction, while readings below 30 suggest oversold levels, possibly preceding a rebound.
A steady RSI near the midpoint suggests that neither buying nor selling pressures dominate, affirming the current lack of directional momentum. This balanced state aligns with the low volatility scenario and hints that ETH could remain range-bound unless a catalyst disrupts the status quo.
Market Waiting for Volatility to Resume
Periods of low volatility often precede sharp market moves as traders await clearer signals before taking aggressive positions. In Ethereum’s case, the narrow price band suggests that investors and traders are cautious, potentially bracing for a breakout.
Without a resurgence in volatility, Ethereum’s price may continue oscillating between the $4,426 support and $4,742 resistance zones. This range-bound behavior can persist for some time, especially in the absence of strong market-moving news or shifts in broader cryptocurrency sentiment.
Potential Scenarios: Breakout or Breakdown
The immediate future for Ethereum depends heavily on whether volatility returns and which side gains momentum.
- Bearish Case: If selling pressure intensifies, ETH could break below the $4,426 support level, triggering further declines. In this scenario, the price might test lower support around $4,211. Such a breakdown would suggest weakening demand and could prompt additional selling activity.
- Bullish Case: Conversely, renewed buying interest could push Ethereum above the $4,742 resistance barrier. Should this occur, ETH may attempt to reclaim its all-time high near $4,957. A successful breakout would signal increased demand and could mark the start of a new upward trend.
Technical Analysis Highlights
- Average True Range (ATR): At 176.54, the declining ATR highlights contracting volatility and a cautious trading environment.
- Relative Strength Index (RSI): The RSI holding steady around 54 suggests a balanced tug-of-war between buyers and sellers.
- Support and Resistance Levels: Key levels to watch are $4,426 (support) and $4,742 (resistance), defining the current trading range.


Comments are closed.