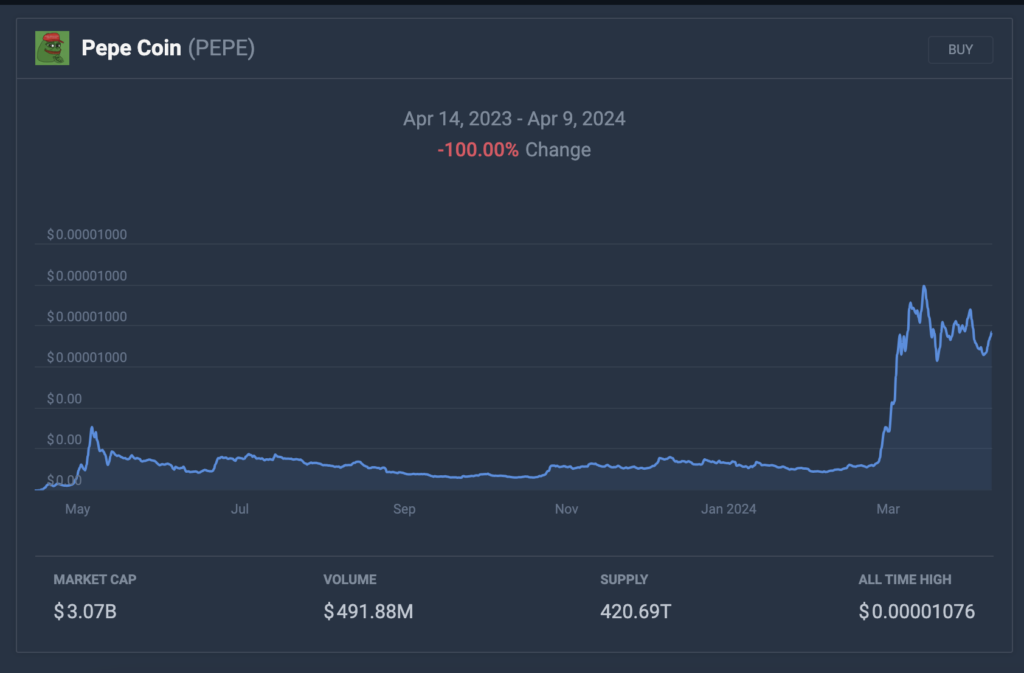
Crypto News– Pepe Coin (PEPE) is currently trading at $0.000008, marking a 4.28% increase over the past 24 hours. This positive performance stands out amidst the broader cryptocurrency market, which experienced a more modest 1.08% increase in total market capitalization during the same timeframe. Additionally, PEPE demonstrated strength against Bitcoin (BTC), recording a 2.34% gain compared to the world’s largest cryptocurrency.
Pepe Coin is currently trading 24.23% lower than our projected price for April 14, 2024
Looking ahead, our Pepe price prediction indicates that PEPE is projected to reach a price of $0.000010 by April 14, 2024. If this prediction holds true, it would signify a notable 30.44% price surge for PEPE over the next 5 days.
Recent Developments: A Look at Pepe Coin Over the Last 30 Days
Over the course of the past 30 days, Pepe Coin has depicted a downward trajectory, reflecting a negative trend with a notable decline of -15.14% in its price. Despite this recent downturn, examining the medium-term performance of Pepe Coin reveals a bullish trend, as the coin has surged impressively by 546.04% over the last 3 months. This substantial growth indicates a period of significant investor interest and positive sentiment surrounding the project during this timeframe.
Moreover, zooming out to assess the long-term perspective, Pepe presents a compelling picture of success, showcasing an astounding 72,813,200.00% price change over the span of the past year. It’s noteworthy to mention that exactly one year ago today, Pepe was trading at a negligible value of $0.000000, highlighting the remarkable journey and exponential growth the coin has experienced since then.
Highlighting a milestone in its price history, Pepe reached its all-time high on March 14, 2024, reaching a peak price of $0.000011. Currently, within its current cycle, Pepe Coin’s price fluctuates between a cycle high of $0.000009 and a cycle low of $0.000006.
Despite these fluctuations, Pepe has exhibited relatively low volatility in recent times, with the 1-month volatility of the coin recorded at 9.73. Additionally, out of the last 30 days, Pepe recorded 14 green days, indicating periods of positive price movement and potential opportunities for investors amidst the observed timeframe.
Analyzing Pepe Coin’s Technical Outlook on April 09, 2024

In the realm of Pepe Coin trading, the prevailing sentiment among investors and traders is currently bullish, with the Fear & Greed index indicating Extreme Greed. This sentiment underscores a prevailing optimism regarding Pepe Coin’s potential trajectory in the near term.
Delving into technical analysis, it’s crucial to identify and monitor key support and resistance levels that can significantly influence price movements. Over the past 30 days, Pepe has demonstrated resilience at several support levels. Notably, $0.000007 emerges as a critical support level, reinforced by repeated testing and holding firm against downward pressure. This level has proven to be pivotal in providing a foundation for Pepe Coin’s price action, warranting close observation moving forward. Furthermore, secondary and tertiary support levels also exist at $0.000007, emphasizing their importance in maintaining bullish momentum.
On the flip side, resistance levels serve as barriers that Pepe must surpass to continue its upward trajectory. At present, $0.000008 emerges as a primary resistance level, with $0.000008 serving as a secondary barrier to upward movement. However, the most significant hurdle lies at $0.000009, representing a key resistance level that Pepe Coin must breach to establish a sustained bullish trend.
Analyzing Pepe Coin: Moving Averages and Oscillators
- Relative Strength Index (RSI 14): The RSI 14 is a popular indicator used to assess whether an asset is overbought or oversold. Currently, the RSI 14 for Pepe stands at 56.28, indicating a neutral stance.
- 50-day Simple Moving Average (SMA 50): The SMA 50 considers the average closing price of Pepe Coin over the past 50 days. Presently, Pepe Coin is trading below the SMA 50 trendline, signaling a bearish trend.
- 200-day Simple Moving Average (SMA 200): The SMA 200 provides insight into the long-term trend by averaging the closing price of Pepe Coin over the last 200 days. Pepe Coin is currently trading below the SMA 200, suggesting a bearish market sentiment.


Leave a comment